Real estate price map
Real estate price map in the municipality of Brantôme en Périgord, choose a section to see transactions by parcel.
Dordogne (24)
Price per m² in Brantôme en Périgord
Median price of real estate
in the municipality of Brantôme en Périgord
Houses
1 600 € /m²
Reliability 9/10
Median price on the 31 transactions of the last 6 months.
from 1 041 to
2 334 € /m²
2 334 € /m²
60% of transactions from the 2nd to the 8th deciles.
Apartments
870 € /m²
Reliability 4/10
Median price on the 11 transactions of the last 60 months.
from 741 to
1 389 € /m²
1 389 € /m²
60% of transactions from the 2nd to the 8th deciles.
Dwellings
1 600 € /m²
Reliability 9/10
Median price on the 31 transactions of the last 6 months.
from 1 041 to
2 334 € /m²
2 334 € /m²
60% of transactions from the 2nd to the 8th deciles.
Evolution of the price per m² of houses since...
1 year
-1.9%
2 years
+6.4%
3 years
+8.8%
4 years
+21%
5 years
+27%
6 years
+32%
7 years
+42%
8 years
+14%
9 years
+21%
10 years
+24%
11 years
+23%
The price per m² of houses has decreased by 1.9% since 1 year, but it has increased by 42% in 7 years.
1300 transactions listed in the municipality
Yearly data
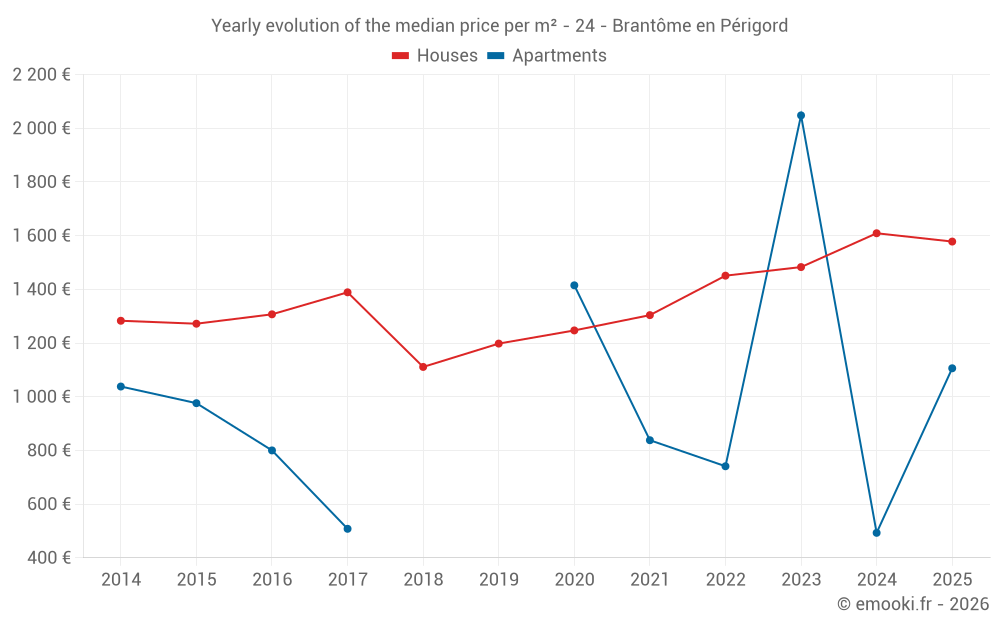
Yearly evolution of the median price per m²
Yearly evolution of the number of transactions

Yearly table
Year
house
transactions
transactions
house
Price per m²
Price per m²
apt.
transactions
transactions
apt.
Price per m²
Price per m²
2025
51
1 578 €
5
1 106 €
2024
41
1 609 €
1
493 €
2023
47
1 483 €
2
2 048 €
2022
69
1 451 €
1
741 €
2021
73
1 304 €
2
838 €
2020
58
1 247 €
1
1 415 €
2019
40
1 198 €
0
--- €
2018
31
1 111 €
0
--- €
2017
49
1 389 €
2
508 €
2016
35
1 307 €
2
800 €
2015
39
1 272 €
2
976 €
2014
18
1 283 €
1
1 038 €
Analysis
Structure of prices per m²
Values of price percentiles per m² over the periods used for the estimated price of each type of property.
Structure of transaction amounts
Values of transaction amounts percentiles over the periods used for the estimated price of each type of property.
Transaction amounts and prices per m² by percentile
Percentile
house
Price per m²
Price per m²
house
Transaction amount
Transaction amount
apt.
Price per m²
Price per m²
apt.
Transaction amount
Transaction amount
10th percentile
625 €
87 468 €
739 €
35 000 €
20th percentile
1 041 €
130 K€
741 €
65 000 €
30th percentile
1 359 €
145 K€
776 €
80 000 €
40th percentile
1 567 €
185 K€
823 €
87 000 €
50th percentile
1 600 €
232 K€
870 €
92 000 €
60th percentile
1 813 €
235 K€
900 €
113 K€
70th percentile
2 005 €
256 K€
1 106 €
128 K€
80th percentile
2 334 €
285 K€
1 389 €
129 K€
90th percentile
2 667 €
415 K€
3 067 €
250 K€
National and departmental comparison
Evolution of the median price per m² of houses
Evolution of the median price per m² of apartments
Quarterly data
Quarterly evolution of the median price per m²
Quarterly evolution of the number of transactions
Quarterly table
Quarter
house
transactions
transactions
house
Price per m²
Price per m²
apt.
transactions
transactions
apt.
Price per m²
Price per m²
2025 Q4
12
1 641 €
0
--- €
2025 Q3
19
1 578 €
0
--- €
2025 Q2
8
1 531 €
3
1 106 €
2025 Q1
12
1 508 €
2
1 903 €
2024 Q4
10
1 590 €
0
--- €
2024 Q3
13
1 609 €
0
--- €
2024 Q2
9
1 642 €
0
--- €
2024 Q1
9
1 523 €
1
493 €
2023 Q4
12
1 534 €
0
--- €
2023 Q3
16
1 599 €
0
--- €
2023 Q2
9
1 398 €
1
870 €
2023 Q1
10
1 080 €
1
3 225 €
2022 Q4
26
1 547 €
0
--- €
2022 Q3
16
1 543 €
0
--- €
2022 Q2
14
1 367 €
0
--- €
2022 Q1
13
1 445 €
1
741 €
2021 Q4
24
1 328 €
0
--- €
2021 Q3
24
1 284 €
0
--- €
2021 Q2
11
1 450 €
2
838 €
2021 Q1
14
1 174 €
0
--- €
2020 Q4
22
1 161 €
1
1 415 €
2020 Q3
13
1 463 €
0
--- €
2020 Q2
12
1 247 €
0
--- €
2020 Q1
11
1 127 €
0
--- €
2019 Q4
10
1 162 €
0
--- €
2019 Q3
11
1 197 €
0
--- €
2019 Q2
12
878 €
0
--- €
2019 Q1
7
1 247 €
0
--- €
2018 Q4
7
1 133 €
0
--- €
2018 Q3
7
770 €
0
--- €
2018 Q2
13
1 250 €
0
--- €
2018 Q1
4
1 140 €
0
--- €
2017 Q4
13
1 468 €
0
--- €
2017 Q3
11
1 373 €
0
--- €
2017 Q2
14
1 438 €
1
461 €
2017 Q1
11
1 127 €
1
556 €
2016 Q4
13
1 173 €
0
--- €
2016 Q3
7
1 582 €
0
--- €
2016 Q2
8
1 294 €
1
308 €
2016 Q1
7
1 307 €
1
1 292 €
2015 Q4
12
1 194 €
1
1 230 €
2015 Q3
11
1 304 €
1
723 €
2015 Q2
10
1 316 €
0
--- €
2015 Q1
6
1 140 €
0
--- €
2014 Q4
8
1 864 €
0
--- €
2014 Q3
4
676 €
1
1 038 €
2014 Q2
1
873 €
0
--- €
2014 Q1
5
1 170 €
0
--- €
Key takeaways
What is the price per m2 of houses in Brantôme en Périgord?
The median price on the 31 house transactions of the last 6 months in the municipality of Brantôme en Périgord was 1 600 € per square meter for a median property value of 231 900 €. Over this period, 60% of transactions were between 1 041 and 2 334 € per square meter (from the 2nd to the 8th deciles).
Compare with neighboring municipalities
City
name
name
house
Price per m²
Price per m²
apt.
Price per m²
Price per m²
City information
Zip codes
- BRANTOME 24310 BRANTOME EN PERIGORD
- LA GONTERIE BOULOUNEIX 24310 BRANTOME EN PERIGORD
- SENCENAC PUY DE FOURCHES 24310 BRANTOME EN PERIGORD
- ST CREPIN DE RICHEMONT 24310 BRANTOME EN PERIGORD
- ST JULIEN DE BOURDEILLES 24310 BRANTOME EN PERIGORD
- VALEUIL 24310 BRANTOME EN PERIGORD
- EYVIRAT 24460 BRANTOME EN PERIGORD
- CANTILLAC 24530 BRANTOME EN PERIGORD