emooki
HomePrice mapTransactions
🇬🇧 English🇫🇷 Français🇩🇪 Deutsch🇪🇸 Español🇮🇹 Italiano

Real estate price map


Real estate price map in the municipality of Saint-Quay-Perros, choose a section to see transactions by parcel.

Côtes-d'Armor (22)

Saint-Quay-Perros - Real estate price m²

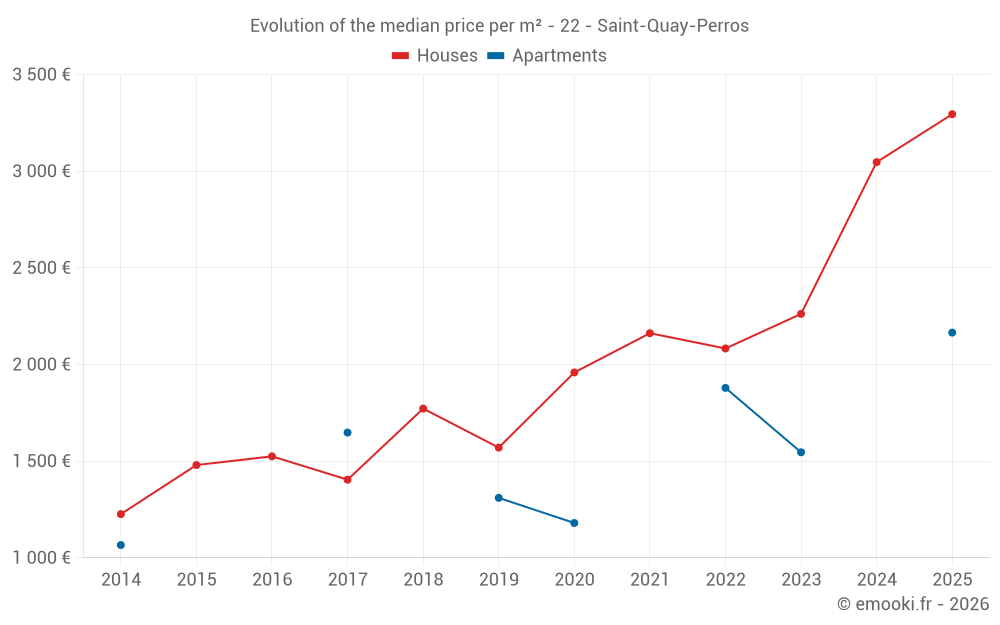
Median price of real estate
in the municipality of Saint-Quay-Perros

HousesHouses
3 183  /m²
1-23-45-67-89-10
Reliability 8/10
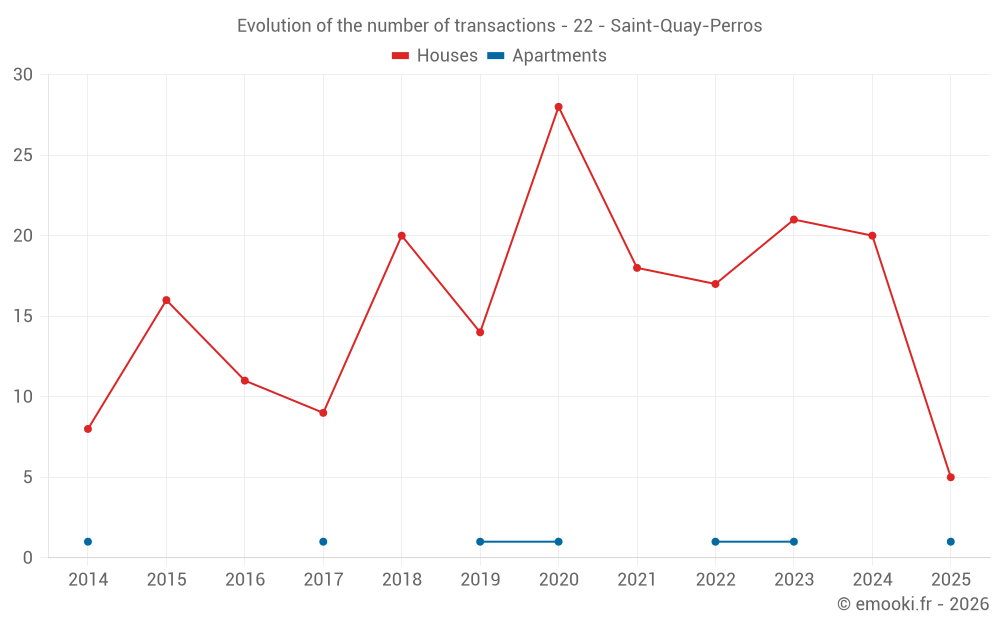
Median price on the 18 transactions of the last 12 months.
from 2 408 to
3 411  /m²
60% of transactions from the 2nd to the 8th deciles.
ApartmentsApartments
1 597  /m²
1-23-45-67-89-10
Reliability 2/10
Median price on the 6 transactions of the last 96 months.
DwellingsDwellings
3 071  /m²
1-23-45-67-89-10
Reliability 8/10
Median price on the 19 transactions of the last 12 months.
from 2 304 to
3 403  /m²
60% of transactions from the 2nd to the 8th deciles.
HousesEvolution of the price per m² of houses since...
1 year
+8.1%
2 years
+46%
3 years
+58%
4 years
+52%
5 years
+68%
6 years
+110%
7 years
+86%
8 years
+135%
9 years
+116%
10 years
+123%
11 years
+169%

Yearly evolution

Evolution of the median price per m²

Evolution of the median price per m² - 22 - Saint-Quay-Perros

Evolution of the number of transactions

Warning, last year incomplete. Projections made based on the proportions between semesters of the previous year at the departmental/national level and by type of property.

Evolution of the number of transactions - 22 - Saint-Quay-Perros

Yearly data

Descending order
Year
Houses
house
transactions
Houses
house
Price per m²
Apartments
apt.
transactions
Apartments
apt.
Price per m²
2025
5
3 295 
1
2 165 
2024
20
3 047 
0
--- 
2023
21
2 262 
1
1 546 
2022
17
2 083 
1
1 879 
2021
18
2 162 
0
--- 
2020
28
1 959 
1
1 180 
2019
14
1 570 
1
1 310 
2018
20
1 772 
0
--- 
2017
9
1 404 
1
1 648 
2016
11
1 525 
0
--- 
2015
16
1 480 
0
--- 
2014
8
1 226 
1
1 066 

Analysis

Structure of prices per m²

Values of price percentiles per m² over the periods used for the estimated price of each type of property.

Structure of transaction amounts

Values of transaction amounts percentiles over the periods used for the estimated price of each type of property.

Transaction amounts and prices per m² by percentile

Ascending order
Percentile
Houses
house
Price per m²
Houses
house
Transaction amount
Apartments
apt.
Price per m²
Apartments
apt.
Transaction amount
10th percentile
2 057 
173 K
1 245 
215 K
20th percentile
2 408 
213 K
1 310 
220 K
30th percentile
2 654 
223 K
1 428 
234 K
40th percentile
2 990 
274 K
1 546 
247 K
50th percentile
3 183 
306 K
1 597 
305 K
60th percentile
3 322 
352 K
1 648 
364 K
70th percentile
3 381 
388 K
1 764 
454 K
80th percentile
3 411 
406 K
1 879 
545 K
90th percentile
3 922 
489 K
2 022 
635 K

National and departmental comparison

Evolution of the median price per m² of houses

Evolution of the median price per m² of apartments

Quarterly evolution

Evolution of the median price per m²

Evolution of the number of transactions

Quarterly data

Descending order
Quarter
Houses
house
transactions
Houses
house
Price per m²
Apartments
apt.
transactions
Apartments
apt.
Price per m²
2025 Q1
5
3 295 
1
2 165 
2024 Q4
6
3 374 
0
--- 
2024 Q3
7
2 857 
0
--- 
2024 Q2
3
3 492 
0
--- 
2024 Q1
4
2 574 
0
--- 
2023 Q4
9
2 333 
1
1 546 
2023 Q3
3
3 162 
0
--- 
2023 Q2
4
2 738 
0
--- 
2023 Q1
5
1 947 
0
--- 
2022 Q4
5
2 121 
0
--- 
2022 Q3
5
2 955 
0
--- 
2022 Q2
4
1 779 
0
--- 
2022 Q1
3
2 016 
1
1 879 
2021 Q4
1
1 905 
0
--- 
2021 Q3
6
2 212 
0
--- 
2021 Q2
9
2 296 
0
--- 
2021 Q1
2
1 760 
0
--- 
2020 Q4
12
2 579 
0
--- 
2020 Q3
6
1 323 
1
1 180 
2020 Q2
5
1 935 
0
--- 
2020 Q1
5
1 978 
0
--- 
2019 Q4
4
1 571 
1
1 310 
2019 Q3
3
1 292 
0
--- 
2019 Q2
3
1 660 
0
--- 
2019 Q1
4
1 905 
0
--- 
2018 Q4
6
2 054 
0
--- 
2018 Q3
4
1 891 
0
--- 
2018 Q2
6
1 750 
0
--- 
2018 Q1
4
1 160 
0
--- 
2017 Q3
3
1 404 
1
1 648 
2017 Q2
3
1 537 
0
--- 
2017 Q1
3
955 
0
--- 
2016 Q4
3
1 143 
0
--- 
2016 Q3
1
1 265 
0
--- 
2016 Q2
2
1 350 
0
--- 
2016 Q1
5
1 783 
0
--- 
2015 Q4
2
1 570 
0
--- 
2015 Q3
5
1 485 
0
--- 
2015 Q2
7
1 469 
0
--- 
2015 Q1
2
1 487 
0
--- 
2014 Q4
1
1 833 
0
--- 
2014 Q3
2
1 402 
0
--- 
2014 Q2
3
1 011 
1
1 066 
2014 Q1
2
1 226 
0
--- 

Overview of the latest real estate transactions

The following list is an anonymized overview of the latest transactions. For more details and to find all transactions, please use the map to view transactions by plot or the transaction search page for a search by criteria.

2025-04-30
30 000 
Sale
Land
678 m2
-Terrains à bâtir
2025-04-30
2 000 000 
522  /m²(3835 m²)
Sale
Commercial property
467 m2
Commercial property
3368 m2
Land
4824 m2
-Sols
2025-04-10
201 
Sale
Land
402 m2
-Sols
2025-03-28
90 000 
2 368  /m²(38 m²)
Sale
Houses
House
2 rooms
38 m2
1 outbuilding
Land
500 m2
-Sols
Land
1308 m2
-Jardins
2025-02-28
450 000 
3 383  /m²(133 m²)
Sale
Houses
House
6 rooms
133 m2
Land
517 m2
-Sols
2025-02-21
34 500 
115  /m²(300 m²)
Sale
Commercial property
300 m2
Land
500 m2
-Sols
Land
1198 m2
-Jardins
Land
142 m2
-Jardins
2025-02-10
120 000 
Sale
Land
684 m2
-Terrains à bâtir
2025-02-07
408 000 
3 429  /m²(119 m²)
Sale
Houses
House
6 rooms
119 m2
Land
505 m2
-Sols
2025-02-06
290 000 
1 239  /m²(234 m²)
Sale
Commercial property
234 m2
Land
1342 m2
-Sols
2025-01-30
363 640 
2 165  /m²(168 m²)
Sale
Apartments
Apartment
3 rooms
98 m2
Apartments
Apartment
3 rooms
70 m2
Land
361 m2
-Sols
Land
371 m2
-Sols
Land
13 m2
-Sols
2025-01-23
280 050 
3 295  /m²(85 m²)
Sale
Land
269 m2
-Sols
Houses
House
4 rooms
85 m2
Land
232 m2
-Terrains à bâtir
Land
441 m2
-Terrains à bâtir
Land
879 m2
-Terrains à bâtir
2025-01-22
316 000 
2 469  /m²(128 m²)
Sale
Houses
House
5 rooms
128 m2
2 outbuildings
Land
500 m2
-Sols
Land
1500 m2
-Jardins
2025-01-13
39 200 
Sale
Land
336 m2
-Terrains à bâtir
2024-12-30
200 000 
4 545  /m²(44 m²)
Sale
Houses
House
3 rooms
44 m2
Land
493 m2
-Sols
2024-12-27
3 000 
Sale
Land
508 m2
-Jardins
2024-12-18
220 000 
3 385  /m²(65 m²)
Sale
Houses
House
4 rooms
65 m2
Land
548 m2
-Sols
2024-12-17
150 000 
882  /m²(170 m²)
Sale
Commercial property
170 m2
Land
500 m2
-Sols
Land
2012 m2
-Jardins
2024-11-28
358 269 
Sale
Land
586 m2
-Terrains à bâtir
2024-11-27
25 000 
Sale
Land
586 m2
-Terrains à bâtir
2024-11-22
295 000 
1 305  /m²(226 m²)
Sale
Houses
House
5 rooms
113 m2
Houses
House
5 rooms
113 m2
Land
1249 m2
-Sols
Land
500 m2
-Sols
Land
28 m2
-Sols
367 transactions listed in the municipality

Côtes-d'Armor (22)

Most expensive cities

City
name
Descending orderHouses
house
Price per m²
6 567 
4 584 
3 889 
3 464 
3 437 
3 340 
3 304 
City
name
Descending orderApartments
apt.
Price per m²
4 805 
4 424 
4 377 
4 271 
3 954 
3 930 

Least expensive cities

City
name
Ascending orderHouses
house
Price per m²
704 
821 
834 
835 
842 
City
name
Ascending orderApartments
apt.
Price per m²
115 
196 
198 
258 
260 
265 
278