Real estate price map
Real estate price map in the municipality of Rostrenen, choose a section to see transactions by parcel.
Côtes-d'Armor (22)
Price per m² in Rostrenen
Median price of real estate
in the municipality of Rostrenen
Houses
1 216 € /m²
Reliability 9/10
Median price on the 29 transactions of the last 6 months.
from 718 to
1 516 € /m²
1 516 € /m²
60% of transactions from the 2nd to the 8th deciles.
Apartments
774 € /m²
Reliability 5/10
Median price on the 11 transactions of the last 48 months.
from 678 to
1 036 € /m²
1 036 € /m²
60% of transactions from the 2nd to the 8th deciles.
Dwellings
1 216 € /m²
Reliability 9/10
Median price on the 29 transactions of the last 6 months.
from 718 to
1 516 € /m²
1 516 € /m²
60% of transactions from the 2nd to the 8th deciles.
Evolution of the price per m² of houses since...
1 year
-4.3%
2 years
+7.7%
3 years
+10%
4 years
+19%
5 years
+35%
6 years
+59%
7 years
+60%
8 years
+53%
9 years
+48%
10 years
+48%
11 years
+46%
The price per m² of houses has decreased by 4.3% since 1 year, but it has increased by 60% in 7 years.
1167 transactions listed in the municipality
Yearly data
Yearly evolution of the median price per m²

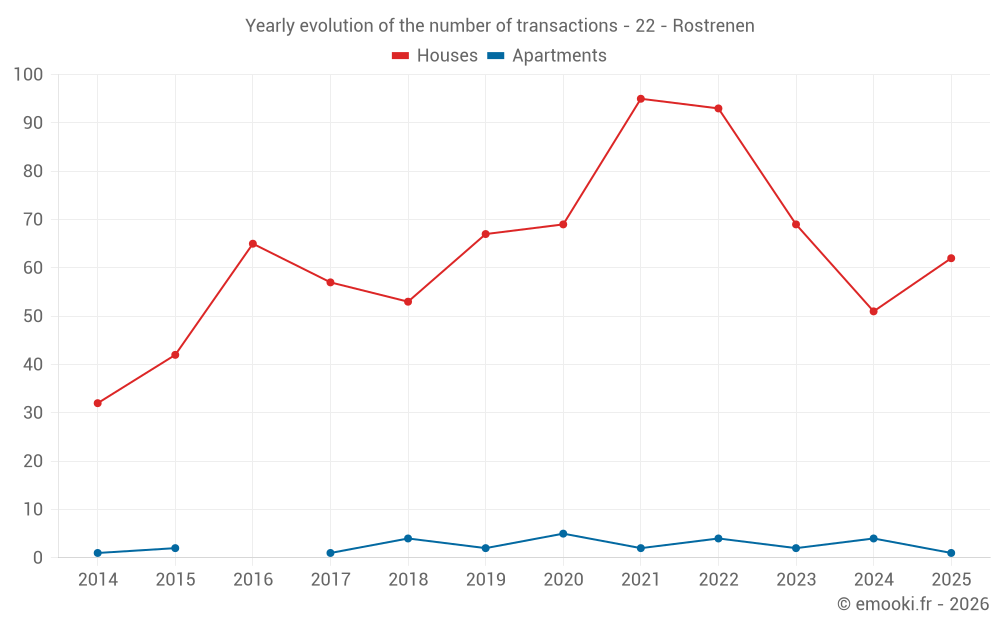
Yearly evolution of the number of transactions
Yearly table
Year
house
transactions
transactions
house
Price per m²
Price per m²
apt.
transactions
transactions
apt.
Price per m²
Price per m²
2025
62
1 077 €
1
823 €
2024
51
1 125 €
4
751 €
2023
69
1 000 €
2
708 €
2022
93
978 €
4
1 052 €
2021
95
904 €
2
356 €
2020
69
800 €
5
405 €
2019
67
679 €
2
1 104 €
2018
53
673 €
4
258 €
2017
57
706 €
1
342 €
2016
65
730 €
0
--- €
2015
42
726 €
2
109 €
2014
32
736 €
1
393 €
Analysis
Structure of prices per m²
Values of price percentiles per m² over the periods used for the estimated price of each type of property.
Structure of transaction amounts
Values of transaction amounts percentiles over the periods used for the estimated price of each type of property.
Transaction amounts and prices per m² by percentile
Percentile
house
Price per m²
Price per m²
house
Transaction amount
Transaction amount
apt.
Price per m²
Price per m²
apt.
Transaction amount
Transaction amount
10th percentile
607 €
48 192 €
600 €
29 000 €
20th percentile
718 €
61 600 €
678 €
48 000 €
30th percentile
1 018 €
65 000 €
728 €
48 000 €
40th percentile
1 147 €
76 600 €
738 €
57 000 €
50th percentile
1 216 €
105 K€
774 €
60 000 €
60th percentile
1 287 €
121 K€
823 €
90 000 €
70th percentile
1 387 €
130 K€
919 €
115 K€
80th percentile
1 516 €
162 K€
1 036 €
116 K€
90th percentile
1 622 €
201 K€
1 068 €
125 K€
National and departmental comparison
Evolution of the median price per m² of houses
Evolution of the median price per m² of apartments
Quarterly data
Quarterly evolution of the median price per m²
Quarterly evolution of the number of transactions
Quarterly table
Quarter
house
transactions
transactions
house
Price per m²
Price per m²
apt.
transactions
transactions
apt.
Price per m²
Price per m²
2025 Q4
11
1 290 €
0
--- €
2025 Q3
18
1 158 €
0
--- €
2025 Q2
21
714 €
1
823 €
2025 Q1
12
1 152 €
0
--- €
2024 Q4
12
1 166 €
2
824 €
2024 Q3
20
1 148 €
0
--- €
2024 Q2
11
981 €
0
--- €
2024 Q1
8
1 005 €
2
514 €
2023 Q4
20
926 €
0
--- €
2023 Q3
15
1 287 €
0
--- €
2023 Q2
18
839 €
1
678 €
2023 Q1
16
1 152 €
1
738 €
2022 Q4
24
973 €
1
1 036 €
2022 Q3
19
1 053 €
0
--- €
2022 Q2
21
1 138 €
3
1 068 €
2022 Q1
29
943 €
0
--- €
2021 Q4
27
883 €
0
--- €
2021 Q3
24
978 €
1
288 €
2021 Q2
22
872 €
0
--- €
2021 Q1
22
938 €
1
424 €
2020 Q4
23
860 €
1
787 €
2020 Q3
20
880 €
2
515 €
2020 Q2
15
656 €
0
--- €
2020 Q1
11
728 €
2
366 €
2019 Q4
25
724 €
1
696 €
2019 Q3
20
621 €
0
--- €
2019 Q2
13
682 €
1
1 512 €
2019 Q1
9
662 €
0
--- €
2018 Q4
17
882 €
1
163 €
2018 Q3
11
725 €
1
354 €
2018 Q2
9
609 €
1
123 €
2018 Q1
16
563 €
1
536 €
2017 Q4
14
729 €
0
--- €
2017 Q3
12
711 €
1
342 €
2017 Q2
21
727 €
0
--- €
2017 Q1
10
699 €
0
--- €
2016 Q4
18
740 €
0
--- €
2016 Q3
18
758 €
0
--- €
2016 Q2
15
797 €
0
--- €
2016 Q1
14
483 €
0
--- €
2015 Q4
12
884 €
2
109 €
2015 Q3
6
702 €
0
--- €
2015 Q2
15
562 €
0
--- €
2015 Q1
9
726 €
0
--- €
2014 Q4
10
863 €
0
--- €
2014 Q3
5
708 €
1
393 €
2014 Q2
11
691 €
0
--- €
2014 Q1
6
788 €
0
--- €
Key takeaways
What is the price per m2 of houses in Rostrenen?
The median price on the 29 house transactions of the last 6 months in the municipality of Rostrenen was 1 216 € per square meter for a median property value of 104 800 €. Over this period, 60% of transactions were between 718 and 1 516 € per square meter (from the 2nd to the 8th deciles).
Compare with neighboring municipalities
City
name
name
house
Price per m²
Price per m²
apt.
Price per m²
Price per m²
City information
Zip codes
- 22110 ROSTRENEN
- BONEN 22110 ROSTRENEN