emooki
HomePrice mapTransactions
🇬🇧 English🇫🇷 Français🇩🇪 Deutsch🇪🇸 Español🇮🇹 Italiano

Real estate price map


Real estate price map in the municipality of Lanvallay, choose a section to see transactions by parcel.

Côtes-d'Armor (22)

Lanvallay - Real estate price m²

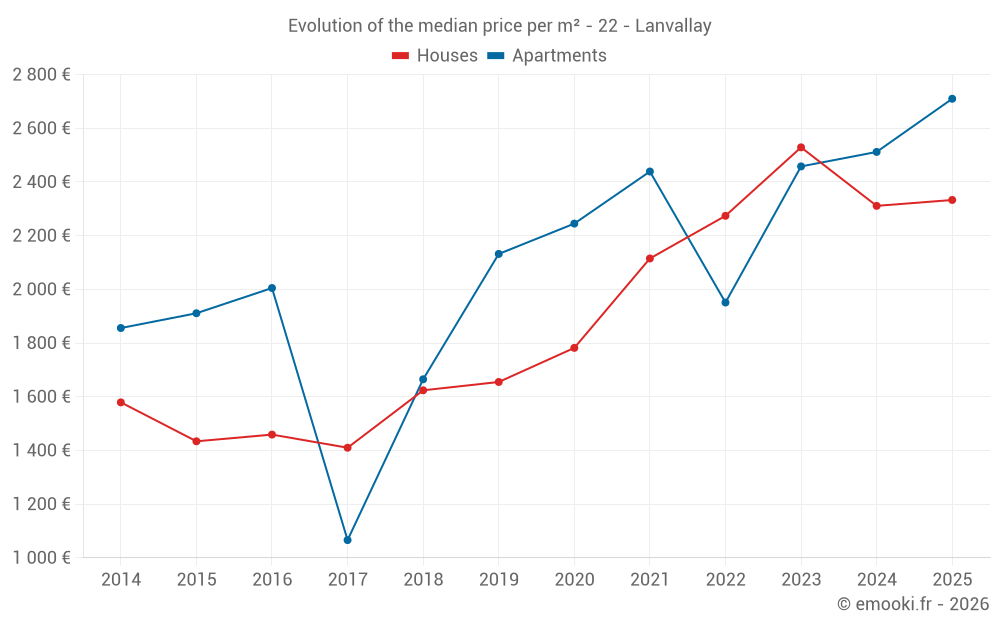
Median price of real estate
in the municipality of Lanvallay

HousesHouses
2 333  /m²
1-23-45-67-89-10
Reliability 9/10
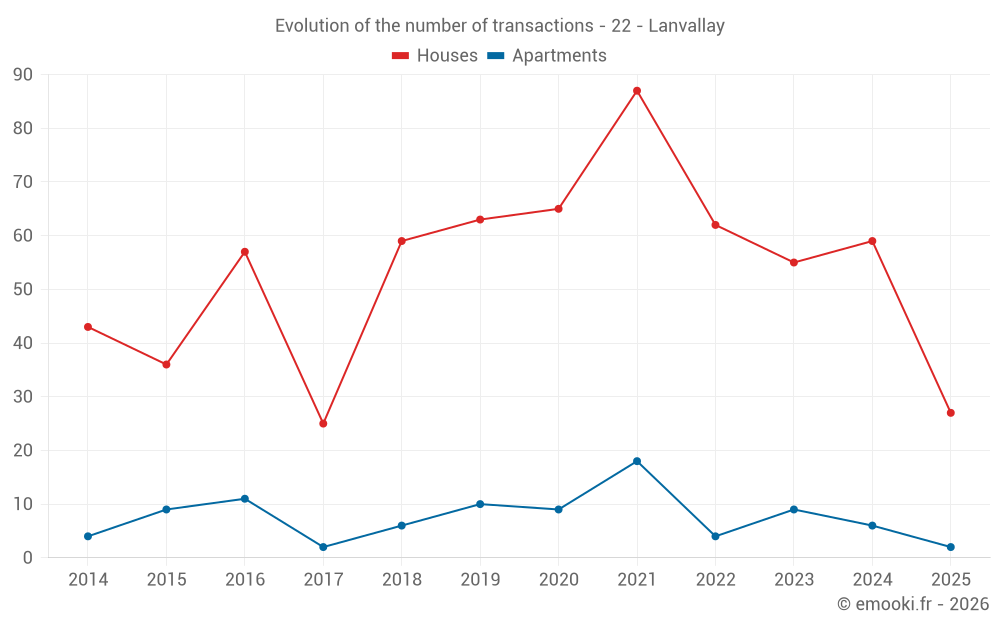
Median price on the 27 transactions of the last 6 months.
from 1 718 to
2 916  /m²
60% of transactions from the 2nd to the 8th deciles.
ApartmentsApartments
2 458  /m²
1-23-45-67-89-10
Reliability 6/10
Median price on the 19 transactions of the last 36 months.
from 1 860 to
2 981  /m²
60% of transactions from the 2nd to the 8th deciles.
DwellingsDwellings
2 333  /m²
1-23-45-67-89-10
Reliability 9/10
Median price on the 29 transactions of the last 6 months.
from 1 743 to
3 016  /m²
60% of transactions from the 2nd to the 8th deciles.
HousesEvolution of the price per m² of houses since...
1 year
+1%
2 years
-7.8%
3 years
+2.6%
4 years
+10%
5 years
+31%
6 years
+41%
7 years
+44%
8 years
+65%
9 years
+60%
10 years
+63%
11 years
+48%
The price per m² of houses has decreased by 7.8% since 2 years, but it has increased by 65% in 8 years.

Yearly evolution

Evolution of the median price per m²

Evolution of the median price per m² - 22 - Lanvallay

Evolution of the number of transactions

Warning, last year incomplete. Projections made based on the proportions between semesters of the previous year at the departmental/national level and by type of property.

Evolution of the number of transactions - 22 - Lanvallay

Yearly data

Descending order
Year
Houses
house
transactions
Houses
house
Price per m²
Apartments
apt.
transactions
Apartments
apt.
Price per m²
2025
27
2 333 
2
2 710 
2024
59
2 311 
6
2 512 
2023
55
2 529 
9
2 458 
2022
62
2 274 
4
1 951 
2021
87
2 115 
18
2 439 
2020
65
1 782 
9
2 245 
2019
63
1 655 
10
2 132 
2018
59
1 624 
6
1 665 
2017
25
1 410 
2
1 066 
2016
57
1 459 
11
2 005 
2015
36
1 434 
9
1 911 
2014
43
1 579 
4
1 856 

Analysis

Structure of prices per m²

Values of price percentiles per m² over the periods used for the estimated price of each type of property.

Structure of transaction amounts

Values of transaction amounts percentiles over the periods used for the estimated price of each type of property.

Transaction amounts and prices per m² by percentile

Ascending order
Percentile
Houses
house
Price per m²
Houses
house
Transaction amount
Apartments
apt.
Price per m²
Apartments
apt.
Transaction amount
10th percentile
1 144 
144 K
1 241 
104 K
20th percentile
1 718 
176 K
1 860 
119 K
30th percentile
2 077 
182 K
2 249 
125 K
40th percentile
2 215 
197 K
2 365 
126 K
50th percentile
2 333 
215 K
2 458 
135 K
60th percentile
2 500 
225 K
2 603 
137 K
70th percentile
2 566 
250 K
2 816 
170 K
80th percentile
2 916 
267 K
2 981 
197 K
90th percentile
3 180 
294 K
3 267 
223 K

National and departmental comparison

Evolution of the median price per m² of houses

Evolution of the median price per m² of apartments

Quarterly evolution

Evolution of the median price per m²

Evolution of the number of transactions

Quarterly data

Descending order
Quarter
Houses
house
transactions
Houses
house
Price per m²
Apartments
apt.
transactions
Apartments
apt.
Price per m²
2025 Q2
8
2 382 
1
2 308 
2025 Q1
19
2 333 
1
3 113 
2024 Q4
18
2 407 
2
3 126 
2024 Q3
16
2 216 
1
2 597 
2024 Q2
16
2 367 
2
1 870 
2024 Q1
9
2 216 
1
951 
2023 Q4
16
2 590 
1
2 893 
2023 Q3
16
2 515 
4
2 648 
2023 Q2
9
2 031 
1
1 875 
2023 Q1
14
2 667 
3
2 210 
2022 Q4
11
2 380 
1
1 838 
2022 Q3
18
2 312 
1
2 782 
2022 Q2
13
1 996 
1
1 873 
2022 Q1
20
2 293 
1
2 029 
2021 Q4
27
2 309 
6
2 496 
2021 Q3
21
2 062 
4
2 122 
2021 Q2
25
2 151 
3
2 487 
2021 Q1
14
2 011 
5
2 297 
2020 Q4
21
1 870 
1
1 471 
2020 Q3
16
1 991 
3
2 093 
2020 Q2
13
1 573 
2
2 688 
2020 Q1
15
1 782 
3
2 245 
2019 Q4
17
1 715 
4
2 170 
2019 Q3
17
1 587 
2
1 576 
2019 Q2
21
1 447 
2
2 394 
2019 Q1
8
1 544 
2
2 132 
2018 Q4
18
1 641 
3
1 523 
2018 Q3
20
1 696 
0
--- 
2018 Q2
8
1 372 
0
--- 
2018 Q1
13
1 667 
3
1 903 
2017 Q4
7
1 410 
0
--- 
2017 Q3
6
1 553 
2
1 066 
2017 Q2
4
1 544 
0
--- 
2017 Q1
8
1 336 
0
--- 
2016 Q4
13
1 269 
0
--- 
2016 Q3
16
1 573 
0
--- 
2016 Q2
21
1 470 
4
1 891 
2016 Q1
7
1 631 
7
2 005 
2015 Q4
6
1 676 
2
1 698 
2015 Q3
10
1 460 
3
1 687 
2015 Q2
10
1 688 
2
1 876 
2015 Q1
10
1 250 
2
2 020 
2014 Q4
7
1 542 
0
--- 
2014 Q3
16
1 336 
1
2 207 
2014 Q2
11
1 694 
2
1 206 
2014 Q1
9
1 798 
1
1 700 

Overview of the latest real estate transactions

The following list is an anonymized overview of the latest transactions. For more details and to find all transactions, please use the map to view transactions by plot or the transaction search page for a search by criteria.

2025-06-20
3 245 
Sale
Land
1698 m2
-Terres
Land
4792 m2
-Prés
2025-05-28
261 900 
2 568  /m²(102 m²)
Sale
Land
58 m2
-Sols
Land
227 m2
-Terrains d'agrément
Houses
House
5 rooms
102 m2
1 outbuilding
Land
500 m2
-Sols
Land
765 m2
-Terrains d'agrément
2025-05-26
110 000 
440  /m²(250 m²)
Sale
Houses
House
4 rooms
135 m2
Houses
House
4 rooms
115 m2
1 outbuilding
Land
667 m2
-Sols
Land
1056 m2
-Jardins
2025-05-21
185 000 
2 229  /m²(83 m²)
Sale
Houses
House
4 rooms
83 m2
Land
412 m2
-Sols
2025-05-16
355 000 
2 536  /m²(140 m²)
Sale
Houses
House
7 rooms
140 m2
1 outbuilding
Land
140 m2
-Sols
Land
1690 m2
-Jardins
2025-05-15
2 000 
Sale
Land
213 m2
-Landes
2025-05-05
1 
Sale
Land
76 m2
-Sols
2025-05-05
1 
Sale
Land
10 m2
-Sols
Land
15 m2
-Sols
2025-05-05
8 802 
Sale
Land
2010 m2
-Terres
Land
8515 m2
-Terres
Land
4018 m2
-Terres
Land
3060 m2
-Terres
2025-05-05
5 818 
Sale
Land
2335 m2
-Taillis simples
Land
8545 m2
-Terres
Land
755 m2
-Terres
2025-04-30
225 000 
1 705  /m²(132 m²)
Sale
Houses
House
4 rooms
132 m2
Land
532 m2
-Sols
2025-04-23
200 000 
3 226  /m²(62 m²)
Sale
Houses
House
4 rooms
62 m2
Land
471 m2
-Sols
2025-04-16
75 000 
Sale
Land
314 m2
-Terrains à bâtir
Land
69 m2
-Sols
Land
52 m2
-Sols
Land
2 m2
-Sols
2025-04-09
215 000 
1 229  /m²(175 m²)
Sale
Houses
House
8 rooms
175 m2
3 outbuildings
Land
838 m2
-Sols
2025-04-08
120 000 
2 308  /m²(52 m²)
Sale
Apartments
Apartment
2 rooms
52 m2
1 outbuilding
2025-04-02
220 000 
2 973  /m²(74 m²)
Sale
Houses
House
4 rooms
74 m2
Land
668 m2
-Sols
2025-03-24
180 000 
2 118  /m²(85 m²)
Sale
Houses
House
5 rooms
85 m2
Land
650 m2
-Sols
2025-03-20
280 000 
2 333  /m²(120 m²)
Sale
Houses
House
4 rooms
120 m2
Land
308 m2
-Sols
2025-03-14
225 000 
2 500  /m²(90 m²)
Sale
Houses
House
5 rooms
90 m2
2 outbuildings
Land
362 m2
-Terrains d'agrément
Land
500 m2
-Sols
2025-03-10
145 000 
3 152  /m²(46 m²)
Sale
Houses
House
3 rooms
46 m2
Land
545 m2
-Sols
1153 transactions listed in the municipality

Côtes-d'Armor (22)

Most expensive cities

City
name
Descending orderHouses
house
Price per m²
6 567 
4 584 
3 889 
3 464 
3 437 
3 340 
3 304 
City
name
Descending orderApartments
apt.
Price per m²
4 805 
4 424 
4 377 
4 271 
3 954 
3 930 

Least expensive cities

City
name
Ascending orderHouses
house
Price per m²
704 
821 
834 
835 
842 
City
name
Ascending orderApartments
apt.
Price per m²
115 
196 
198 
258 
260 
265 
278