emooki
HomePrice mapTransactions
🇬🇧 English🇫🇷 Français🇩🇪 Deutsch🇪🇸 Español🇮🇹 Italiano

Real estate price map


Real estate price map in the municipality of Foëcy, choose a section to see transactions by parcel.

Cher (18)
Foëcy

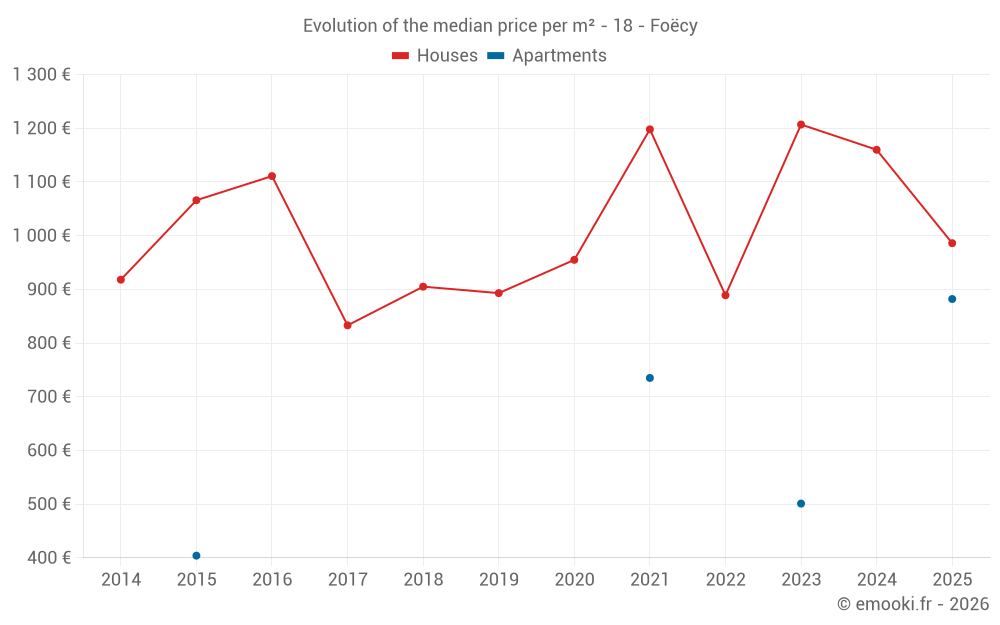
Median price of real estate
in the municipality of Foëcy

HousesHouses
1 080  /m²
1-23-45-67-89-10
Reliability 8/10
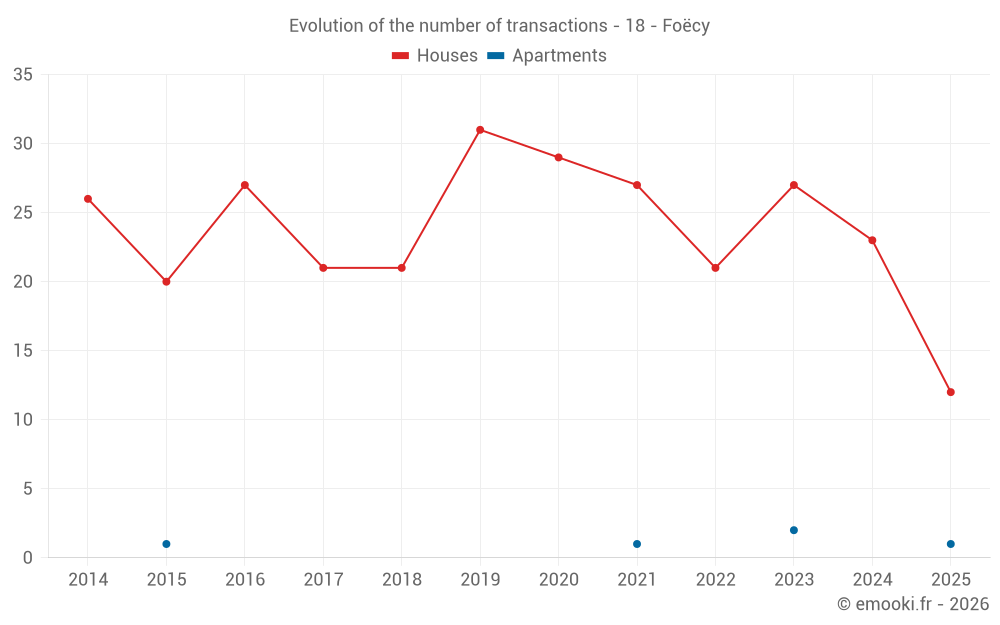
Median price on the 28 transactions of the last 12 months.
from 713 to
1 617  /m²
60% of transactions from the 2nd to the 8th deciles.
ApartmentsApartments
634  /m²
1-23-45-67-89-10
Reliability 2/10
Median price on the 4 transactions of the last 96 months.
DwellingsDwellings
1 023  /m²
1-23-45-67-89-10
Reliability 8/10
Median price on the 29 transactions of the last 12 months.
from 763 to
1 612  /m²
60% of transactions from the 2nd to the 8th deciles.
HousesEvolution of the price per m² of houses since...
1 year
-15%
2 years
-18%
3 years
+11%
4 years
-18%
5 years
+3.2%
6 years
+10%
7 years
+9%
8 years
+18%
9 years
-11%
10 years
-7.5%
11 years
+7.4%
The price per m² of houses has decreased by 18% since 2 years, but it has increased by 18% in 8 years.

Yearly evolution

Evolution of the median price per m²

Evolution of the number of transactions

Warning, last year incomplete. Projections made based on the proportions between semesters of the previous year at the departmental/national level and by type of property.

Yearly data

Descending order
Year
Houses
house
transactions
Houses
house
Price per m²
Apartments
apt.
transactions
Apartments
apt.
Price per m²
2025
12
986 
1
882 
2024
23
1 160 
0
--- 
2023
27
1 207 
2
501 
2022
21
889 
0
--- 
2021
27
1 198 
1
735 
2020
29
955 
0
--- 
2019
31
893 
0
--- 
2018
21
905 
0
--- 
2017
21
833 
0
--- 
2016
27
1 111 
0
--- 
2015
20
1 066 
1
404 
2014
26
918 
0
--- 

Analysis

Structure of prices per m²

Values of price percentiles per m² over the periods used for the estimated price of each type of property.

Structure of transaction amounts

Values of transaction amounts percentiles over the periods used for the estimated price of each type of property.

Transaction amounts and prices per m² by percentile

Ascending order
Percentile
Houses
house
Price per m²
Houses
house
Transaction amount
Apartments
apt.
Price per m²
Apartments
apt.
Transaction amount
10th percentile
467 
27 300 
489 
78 750 
20th percentile
713 
46 400 
507 
84 000 
30th percentile
980 
55 000 
526 
89 250 
40th percentile
1 011 
59 000 
573 
91 400 
50th percentile
1 080 
80 800 
634 
92 000 
60th percentile
1 223 
98 400 
694 
92 600 
70th percentile
1 390 
127 K
750 
94 200 
80th percentile
1 617 
146 K
794 
97 800 
90th percentile
1 743 
164 K
838 
101 K

National and departmental comparison

Evolution of the median price per m² of houses

Evolution of the median price per m² of apartments

Quarterly evolution

Evolution of the median price per m²

Evolution of the number of transactions

Quarterly data

Descending order
Quarter
Houses
house
transactions
Houses
house
Price per m²
Apartments
apt.
transactions
Apartments
apt.
Price per m²
2025 Q2
3
487 
1
882 
2025 Q1
9
1 138 
0
--- 
2024 Q4
8
1 295 
0
--- 
2024 Q3
8
1 022 
0
--- 
2024 Q2
1
1 215 
0
--- 
2024 Q1
6
984 
0
--- 
2023 Q4
8
1 208 
1
532 
2023 Q3
3
901 
1
470 
2023 Q2
6
898 
0
--- 
2023 Q1
10
1 264 
0
--- 
2022 Q4
2
760 
0
--- 
2022 Q3
10
1 000 
0
--- 
2022 Q2
6
744 
0
--- 
2022 Q1
3
1 598 
0
--- 
2021 Q4
6
1 440 
0
--- 
2021 Q3
5
975 
1
735 
2021 Q2
12
1 290 
0
--- 
2021 Q1
4
1 158 
0
--- 
2020 Q4
5
789 
0
--- 
2020 Q3
10
1 304 
0
--- 
2020 Q2
5
855 
0
--- 
2020 Q1
9
611 
0
--- 
2019 Q4
9
968 
0
--- 
2019 Q3
4
600 
0
--- 
2019 Q2
9
819 
0
--- 
2019 Q1
9
893 
0
--- 
2018 Q4
6
1 049 
0
--- 
2018 Q3
9
905 
0
--- 
2018 Q2
3
331 
0
--- 
2018 Q1
3
1 047 
0
--- 
2017 Q4
4
903 
0
--- 
2017 Q3
5
1 225 
0
--- 
2017 Q2
5
833 
0
--- 
2017 Q1
7
722 
0
--- 
2016 Q4
10
1 100 
0
--- 
2016 Q3
8
1 334 
0
--- 
2016 Q2
3
725 
0
--- 
2016 Q1
6
870 
0
--- 
2015 Q4
4
1 068 
0
--- 
2015 Q3
4
681 
0
--- 
2015 Q2
7
1 103 
1
404 
2015 Q1
5
1 129 
0
--- 
2014 Q4
9
767 
0
--- 
2014 Q3
3
1 641 
0
--- 
2014 Q2
5
1 075 
0
--- 
2014 Q1
9
1 047 
0
--- 

Overview of the latest real estate transactions

The following list is an anonymized overview of the latest transactions. For more details and to find all transactions, please use the map to view transactions by plot or the transaction search page for a search by criteria.

2025-06-27
800 000 
743  /m²(1076 m²)
Sale
Land
291 m2
-Sols
Commercial property
876 m2
Commercial property
200 m2
Land
320 m2
-Sols
Land
1573 m2
-Sols
2025-06-06
1 300 
Sale
Land
700 m2
-Jardins
Land
209 m2
-Jardins
2025-06-04
27 000 
95  /m²(285 m²)
Sale
Land
122 m2
-Sols
Commercial property
285 m2
Land
368 m2
-Sols
Land
50 m2
-Sols
2025-05-31
1 000 
Sale
Land
1750 m2
-Vignes
2025-05-28
2 000 
Sale
Land
694 m2
-Sols
Land
42 m2
-Jardins
Land
44 m2
-Jardins
Land
209 m2
-Jardins
2025-05-28
20 000 
Sale
Land
300 m2
-Prés
Land
3300 m2
-Prés
Land
8900 m2
-Prés
2025-05-20
750 
Sale
Land
460 m2
-Terres
2025-05-16
1 500 
Sale
Land
1410 m2
-Terres
Land
4590 m2
-Terres
2025-04-30
105 000 
882  /m²(119 m²)
Sale
Apartments
Apartment
3 rooms
58 m2
Apartments
Apartment
3 rooms
61 m2
4 outbuildings
Land
297 m2
-Sols
Land
83 m2
-Sols
Land
112 m2
-Sols
Land
563 m2
-Jardins
2025-04-24
2 500 
Sale
Land
230 m2
-Terres
2025-04-24
157 500 
991  /m²(159 m²)
Sale
Houses
House
7 rooms
159 m2
2 outbuildings
Land
1335 m2
-Sols
Land
21 m2
-Sols
Land
616 m2
-Vignes
Land
900 m2
-Terres
2025-04-09
21 000 
420  /m²(50 m²)
Sale
Houses
House
4 rooms
50 m2
2 outbuildings
Land
564 m2
-Sols
2025-04-03
55 000 
487  /m²(113 m²)
Sale
Houses
House
2 rooms
75 m2
1 outbuilding
Land
209 m2
-Sols
Land
69 m2
-Sols
Houses
House
1 room
38 m2
1 outbuilding
Land
83 m2
-Sols
Land
123 m2
-Sols
Land
1124 m2
-Jardins
2025-03-15
9 000 
Sale
1 outbuilding
Land
1205 m2
-Vignes
Land
863 m2
-Jardins
Land
317 m2
-Sols
Land
392 m2
-Prés
2025-03-14
135 000 
1 627  /m²(83 m²)
Sale
Land
327 m2
-Sols
Houses
House
4 rooms
83 m2
Land
603 m2
-Sols
2025-03-11
55 000 
965  /m²(57 m²)
Sale
Houses
House
3 rooms
57 m2
Land
594 m2
-Sols
2025-03-08
38 000 
507  /m²(75 m²)
Sale
Houses
House
4 rooms
75 m2
Land
98 m2
-Sols
1 outbuilding
Land
14 m2
-Sols
Land
377 m2
-Sols
Land
144 m2
-Sols
Land
1030 m2
-Sols
2025-03-01
190 000 
1 138  /m²(167 m²)
Sale
Houses
House
5 rooms
167 m2
2 outbuildings
Land
756 m2
-Sols
2025-03-01
1 243 
Sale
Land
740 m2
-Terres
2025-03-01
3 360 
Sale
Land
640 m2
-Terres
Land
1360 m2
-Sols
442 transactions listed in the municipality

Cher (18)

Most expensive cities

City
name
Descending orderHouses
house
Price per m²
1 902 
1 892 
1 870 
1 810 
1 764 
1 730 
1 700 
1 692 
City
name
Descending orderApartments
apt.
Price per m²
28 462 
2 682 
1 718 
1 663 
1 623 
1 498 
1 444 
1 291 

Least expensive cities

City
name
Ascending orderHouses
house
Price per m²
404 
427 
526 
556 
563 
563 
City
name
Ascending orderApartments
apt.
Price per m²
26 
31 
135 
156