emooki
HomePrice mapTransactions
🇬🇧 English🇫🇷 Français🇩🇪 Deutsch🇪🇸 Español🇮🇹 Italiano

Real estate price map


Real estate price map in the municipality of Valuéjols, choose a section to see transactions by parcel.

Cantal (15)
Valuéjols

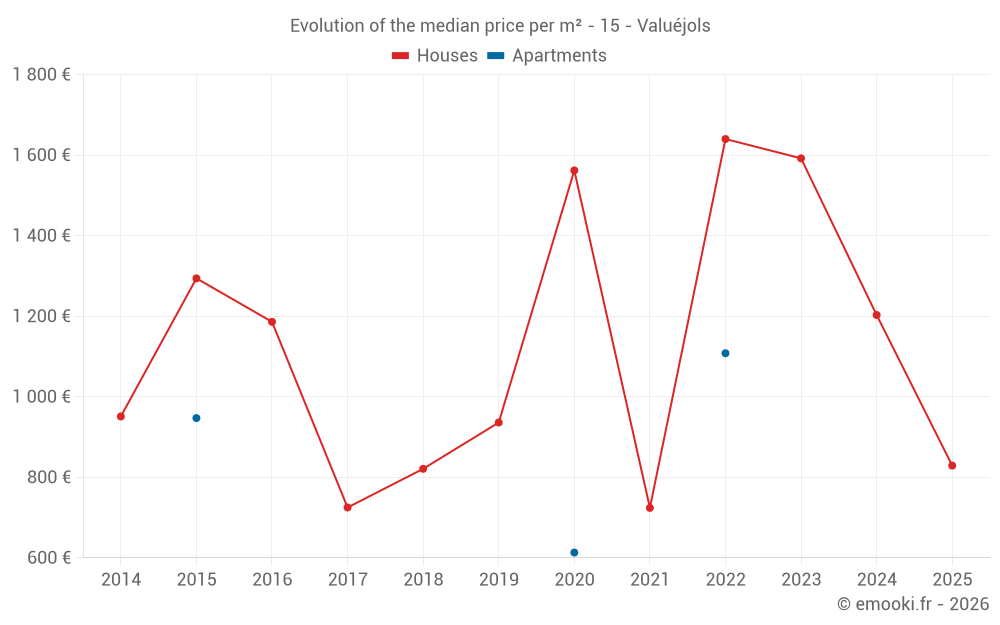
Median price of real estate
in the municipality of Valuéjols

HousesHouses
1 000  /m²
1-23-45-67-89-10
Reliability 5/10
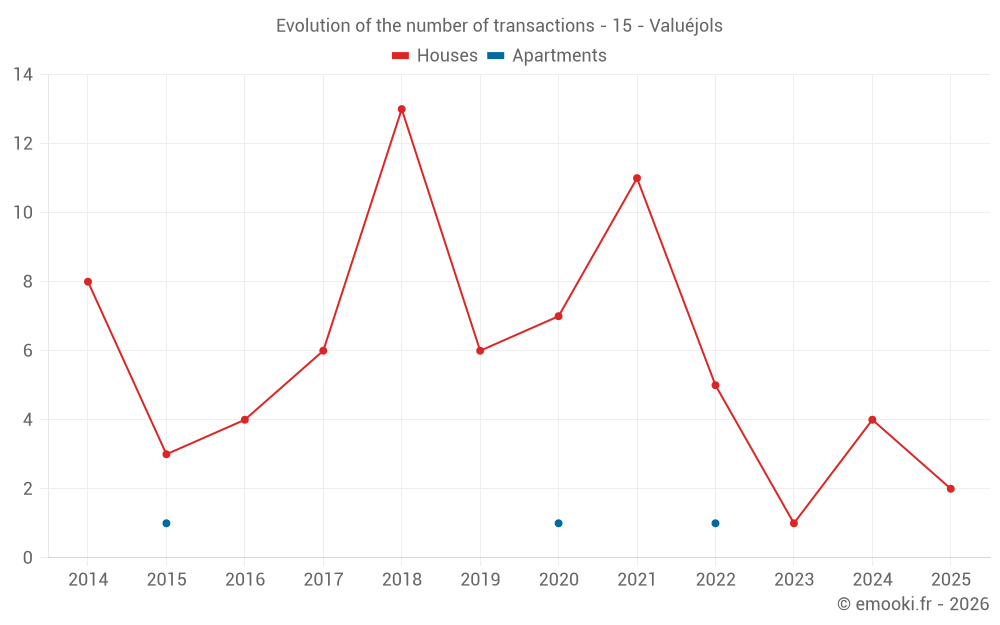
Median price on the 19 transactions of the last 48 months.
from 698 to
1 611  /m²
60% of transactions from the 2nd to the 8th deciles.
ApartmentsApartments
947  /m²
1-23-45-67-89-10
Reliability 1/10
Median price on the 3 transactions of the last 120 months.
DwellingsDwellings
1 018  /m²
1-23-45-67-89-10
Reliability 5/10
Median price on the 20 transactions of the last 48 months.
from 711 to
1 602  /m²
60% of transactions from the 2nd to the 8th deciles.

Yearly evolution

Evolution of the median price per m²

Evolution of the median price per m² - 15 - Valuéjols

Evolution of the number of transactions

Warning, last year incomplete. Projections made based on the proportions between semesters of the previous year at the departmental/national level and by type of property.

Evolution of the number of transactions - 15 - Valuéjols

Yearly data

Descending order
Year
Houses
house
transactions
Houses
house
Price per m²
Apartments
apt.
transactions
Apartments
apt.
Price per m²
2025
2
829 
0
--- 
2024
4
1 203 
0
--- 
2023
1
1 592 
0
--- 
2022
5
1 640 
1
1 108 
2021
11
724 
0
--- 
2020
7
1 562 
1
613 
2019
6
936 
0
--- 
2018
13
821 
0
--- 
2017
6
725 
0
--- 
2016
4
1 186 
0
--- 
2015
3
1 294 
1
947 
2014
8
951 
0
--- 

Analysis

Structure of prices per m²

Values of price percentiles per m² over the periods used for the estimated price of each type of property.

Structure of transaction amounts

Values of transaction amounts percentiles over the periods used for the estimated price of each type of property.

Transaction amounts and prices per m² by percentile

Ascending order
Percentile
Houses
house
Price per m²
Houses
house
Transaction amount
Apartments
apt.
Price per m²
Apartments
apt.
Transaction amount
10th percentile
642 
54 200 
680 
109 K
20th percentile
698 
59 200 
747 
127 K
30th percentile
819 
74 350 
813 
144 K
40th percentile
942 
88 464 
880 
162 K
50th percentile
1 000 
96 000 
947 
179 K
60th percentile
1 358 
141 K
979 
185 K
70th percentile
1 481 
145 K
1 011 
191 K
80th percentile
1 611 
174 K
1 044 
197 K
90th percentile
1 789 
184 K
1 076 
203 K

National and departmental comparison

Evolution of the median price per m² of houses

Evolution of the median price per m² of apartments

Quarterly evolution

Evolution of the median price per m²

Evolution of the number of transactions

Quarterly data

Descending order
Quarter
Houses
house
transactions
Houses
house
Price per m²
Apartments
apt.
transactions
Apartments
apt.
Price per m²
2025 Q2
1
658 
0
--- 
2025 Q1
1
1 000 
0
--- 
2024 Q4
2
1 196 
0
--- 
2024 Q2
1
938 
0
--- 
2024 Q1
1
1 781 
0
--- 
2023 Q3
1
1 592 
0
--- 
2022 Q3
3
1 640 
0
--- 
2022 Q2
2
1 594 
1
1 108 
2021 Q4
3
724 
0
--- 
2021 Q3
4
894 
0
--- 
2021 Q2
3
675 
0
--- 
2021 Q1
1
206 
0
--- 
2020 Q4
2
1 634 
1
613 
2020 Q3
3
857 
0
--- 
2020 Q2
2
1 150 
0
--- 
2019 Q4
2
1 030 
0
--- 
2019 Q3
1
2 536 
0
--- 
2019 Q2
1
667 
0
--- 
2019 Q1
2
924 
0
--- 
2018 Q4
6
945 
0
--- 
2018 Q3
4
873 
0
--- 
2018 Q2
1
162 
0
--- 
2018 Q1
2
714 
0
--- 
2017 Q4
1
262 
0
--- 
2017 Q3
1
389 
0
--- 
2017 Q2
1
800 
0
--- 
2017 Q1
3
953 
0
--- 
2016 Q4
2
910 
0
--- 
2016 Q3
1
1 313 
0
--- 
2016 Q2
1
1 058 
0
--- 
2015 Q4
0
--- 
1
947 
2015 Q3
1
1 294 
0
--- 
2015 Q2
2
1 274 
0
--- 
2014 Q4
2
1 134 
0
--- 
2014 Q2
1
706 
0
--- 
2014 Q1
5
1 000 
0
--- 

Overview of the latest real estate transactions

The following list is an anonymized overview of the latest transactions. For more details and to find all transactions, please use the map to view transactions by plot or the transaction search page for a search by criteria.

2025-04-14
15 000 
Sale
Land
3811 m2
-Terres
Land
1480 m2
-Prés
Land
3166 m2
-Prés
Land
4780 m2
-Sols
Land
423 m2
-Prés
2025-04-08
79 000 
658  /m²(120 m²)
Sale
Houses
House
3 rooms
120 m2
Land
300 m2
-Sols
2025-02-25
4 452 
Sale
Land
371 m2
-Pâtures
2025-01-25
90 000 
1 000  /m²(90 m²)
Sale
Houses
House
4 rooms
90 m2
2 outbuildings
Land
1400 m2
-Sols
2024-12-31
23 000 
Sale
Land
35 m2
-Sols
Land
878 m2
-Prés
Land
439 m2
-Prés
2024-12-12
60 000 
923  /m²(65 m²)
Sale
Houses
House
3 rooms
65 m2
1 outbuilding
Land
130 m2
-Sols
2024-10-17
4 651 
Sale
Land
3411 m2
-Bois
Land
4342 m2
-Futaies résineuses
/Pins
2024-10-15
88 080 
1 468  /m²(60 m²)
Sale
Houses
House
2 rooms
60 m2
Land
380 m2
-Sols
Land
534 m2
-Landes
2024-09-14
18 000 
Sale
Land
4072 m2
-Prés
Land
1428 m2
-Prés
Land
10196 m2
-Prés
Land
29084 m2
-Prés
2024-09-13
21 108 
Sale
Land
1000 m2
-Prés
Land
3440 m2
-Prés
Land
9000 m2
-Prés
Land
21740 m2
-Terres
2024-08-26
4 250 
Sale
Land
850 m2
-Sols
2024-08-21
650 
Sale
Land
1217 m2
-Prés
2024-08-21
25 680 
Sale
Land
1040 m2
-Landes
Land
1100 m2
-Prés
2024-07-31
50 000 
Sale
Land
15000 m2
-Pâtures
Land
6310 m2
-Prés
Land
6000 m2
-Prés
Land
12200 m2
-Terres
Land
33530 m2
-Terres
2024-06-13
18 000 
Sale
Land
1204 m2
-Prés
Land
2246 m2
-Prés
2024-06-03
136 000 
938  /m²(145 m²)
Sale
Houses
House
5 rooms
145 m2
Land
1119 m2
-Sols
2024-05-16
22 140 
Sale
Land
1845 m2
-Pâtures
2024-05-02
9 000 
Sale
Land
650 m2
-Sols
2024-03-13
15 000 
Sale
1 outbuilding
Land
68 m2
-Sols
Land
75 m2
-Sols
Land
310 m2
-Sols
2024-02-24
9 012 
Sale
Land
751 m2
-Terrains à bâtir
/Chemin (non groupe)
176 transactions listed in the municipality

Cantal (15)

Most expensive cities

City
name
Descending orderHouses
house
Price per m²
2 094 
1 996 
1 974 
1 887 
1 816 
1 805 
1 800 
City
name
Descending orderApartments
apt.
Price per m²
6 674 
2 440 
2 318 
1 932 
1 476 

Least expensive cities

City
name
Ascending orderHouses
house
Price per m²
370 
393 
417 
443 
458 
484 
496 
City
name
Ascending orderApartments
apt.
Price per m²
68 
94 
148 
160 
175 
188