emooki
HomePrice mapTransactions
🇬🇧 English🇫🇷 Français🇩🇪 Deutsch🇪🇸 Español🇮🇹 Italiano

Real estate price map


Real estate price map in the municipality of Ver-sur-Mer, choose a section to see transactions by parcel.

Calvados (14)

Ver-sur-Mer - Real estate price m²

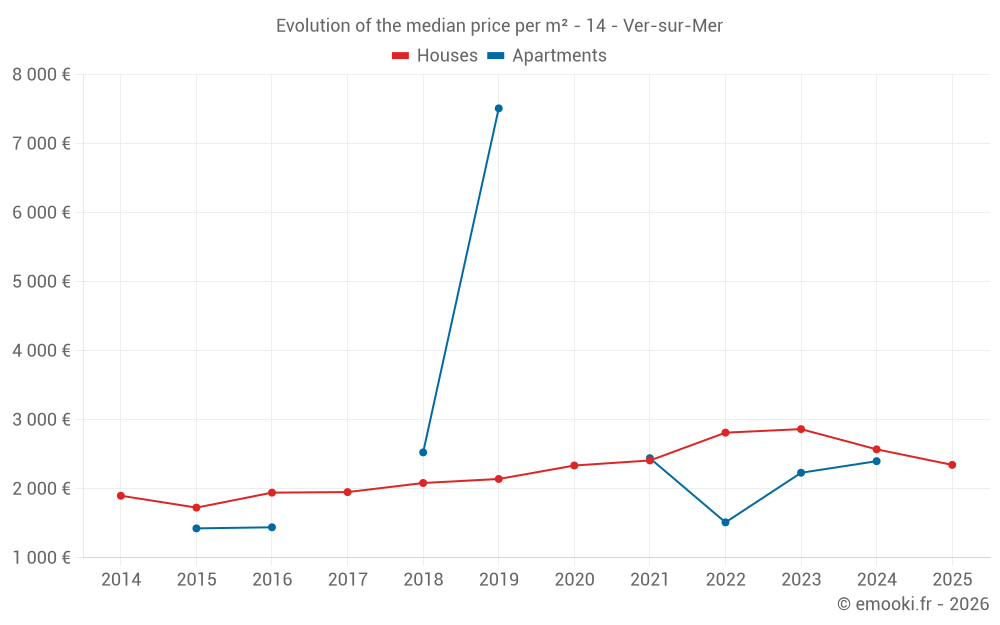
Median price of real estate
in the municipality of Ver-sur-Mer

HousesHouses
2 366  /m²
1-23-45-67-89-10
Reliability 8/10
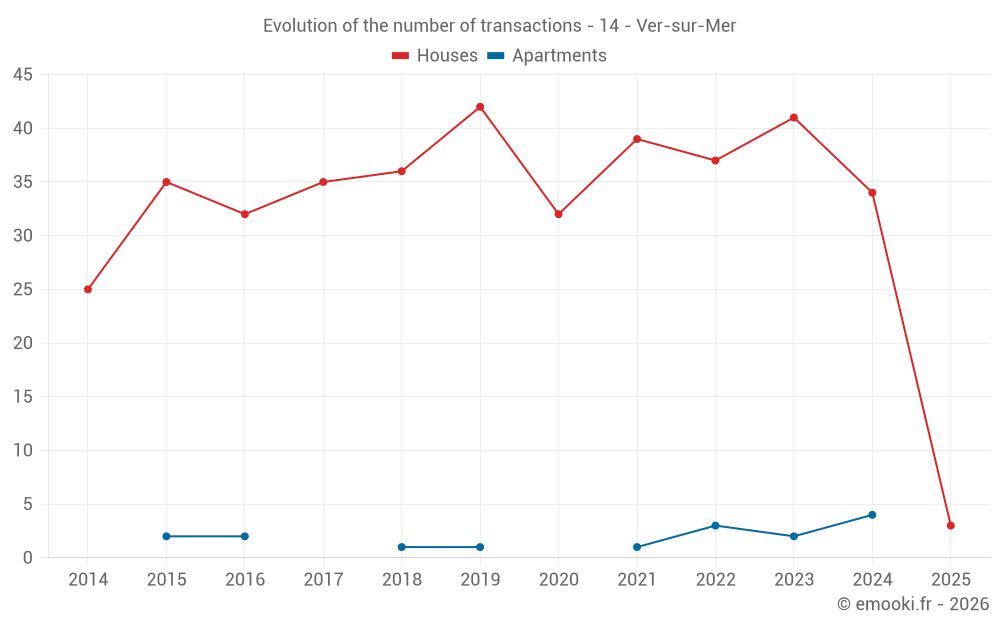
Median price on the 16 transactions of the last 12 months.
from 2 049 to
3 078  /m²
60% of transactions from the 2nd to the 8th deciles.
ApartmentsApartments
2 296  /m²
1-23-45-67-89-10
Reliability 4/10
Median price on the 10 transactions of the last 60 months.
DwellingsDwellings
2 385  /m²
1-23-45-67-89-10
Reliability 8/10
Median price on the 19 transactions of the last 12 months.
from 2 132 to
3 082  /m²
60% of transactions from the 2nd to the 8th deciles.

Yearly evolution

Evolution of the median price per m²

Evolution of the median price per m² - 14 - Ver-sur-Mer

Evolution of the number of transactions

Warning, last year incomplete. Projections made based on the proportions between semesters of the previous year at the departmental/national level and by type of property.

Evolution of the number of transactions - 14 - Ver-sur-Mer

Yearly data

Descending order
Year
Houses
house
transactions
Houses
house
Price per m²
Apartments
apt.
transactions
Apartments
apt.
Price per m²
2025
3
2 346 
0
--- 
2024
34
2 571 
4
2 400 
2023
41
2 864 
2
2 232 
2022
37
2 813 
3
1 513 
2021
39
2 410 
1
2 443 
2020
32
2 337 
0
--- 
2019
42
2 142 
1
7 511 
2018
36
2 084 
1
2 527 
2017
35
1 952 
0
--- 
2016
32
1 944 
2
1 442 
2015
35
1 727 
2
1 426 
2014
25
1 899 
0
--- 

Analysis

Structure of prices per m²

Values of price percentiles per m² over the periods used for the estimated price of each type of property.

Structure of transaction amounts

Values of transaction amounts percentiles over the periods used for the estimated price of each type of property.

Transaction amounts and prices per m² by percentile

Ascending order
Percentile
Houses
house
Price per m²
Houses
house
Transaction amount
Apartments
apt.
Price per m²
Apartments
apt.
Transaction amount
10th percentile
1 989 
125 K
1 477 
155 K
20th percentile
2 049 
178 K
1 898 
164 K
30th percentile
2 197 
214 K
2 097 
169 K
40th percentile
2 273 
246 K
2 217 
176 K
50th percentile
2 366 
249 K
2 296 
185 K
60th percentile
2 461 
251 K
2 352 
200 K
70th percentile
2 647 
270 K
2 397 
248 K
80th percentile
3 078 
310 K
2 413 
330 K
90th percentile
3 352 
316 K
2 508 
352 K

National and departmental comparison

Evolution of the median price per m² of houses

Evolution of the median price per m² of apartments

Quarterly evolution

Evolution of the median price per m²

Evolution of the number of transactions

Quarterly data

Descending order
Quarter
Houses
house
transactions
Houses
house
Price per m²
Apartments
apt.
transactions
Apartments
apt.
Price per m²
2025 Q1
3
2 346 
0
--- 
2024 Q4
8
2 197 
0
--- 
2024 Q3
5
2 676 
3
2 394 
2024 Q2
13
2 642 
1
2 405 
2024 Q1
8
2 786 
0
--- 
2023 Q4
9
3 284 
1
2 324 
2023 Q3
11
2 848 
0
--- 
2023 Q2
16
2 646 
1
2 141 
2023 Q1
5
2 792 
0
--- 
2022 Q4
6
2 247 
0
--- 
2022 Q3
13
2 813 
2
1 754 
2022 Q2
12
3 061 
0
--- 
2022 Q1
6
2 338 
1
1 150 
2021 Q4
15
2 483 
0
--- 
2021 Q3
10
2 536 
0
--- 
2021 Q2
9
2 410 
1
2 443 
2021 Q1
5
1 985 
0
--- 
2020 Q4
16
2 337 
0
--- 
2020 Q3
6
2 600 
0
--- 
2020 Q2
4
1 858 
0
--- 
2020 Q1
6
2 794 
0
--- 
2019 Q4
12
2 103 
0
--- 
2019 Q3
17
1 981 
0
--- 
2019 Q2
7
2 367 
1
7 511 
2019 Q1
6
2 497 
0
--- 
2018 Q4
9
2 039 
1
2 527 
2018 Q3
13
2 085 
0
--- 
2018 Q2
11
2 338 
0
--- 
2018 Q1
3
1 988 
0
--- 
2017 Q4
6
1 708 
0
--- 
2017 Q3
7
2 246 
0
--- 
2017 Q2
16
1 970 
0
--- 
2017 Q1
6
1 797 
0
--- 
2016 Q4
13
1 811 
0
--- 
2016 Q3
8
1 885 
1
1 779 
2016 Q2
5
2 070 
1
1 104 
2016 Q1
6
1 766 
0
--- 
2015 Q4
11
2 037 
1
1 075 
2015 Q3
9
1 563 
1
1 777 
2015 Q2
6
1 828 
0
--- 
2015 Q1
9
1 727 
0
--- 
2014 Q4
6
2 186 
0
--- 
2014 Q3
10
1 760 
0
--- 
2014 Q2
6
1 764 
0
--- 
2014 Q1
3
2 102 
0
--- 

Overview of the latest real estate transactions

The following list is an anonymized overview of the latest transactions. For more details and to find all transactions, please use the map to view transactions by plot or the transaction search page for a search by criteria.

2025-03-26
251 000 
2 346  /m²(107 m²)
Sale
Land
41 m2
-Sols
Houses
House
5 rooms
107 m2
1 outbuilding
Land
118 m2
-Sols
Land
175 m2
-Jardins
2025-03-17
251 300 
2 618  /m²(96 m²)
Sale
Houses
House
5 rooms
96 m2
Land
610 m2
-Sols
2025-03-10
316 000 
2 273  /m²(139 m²)
Sale
Houses
House
7 rooms
139 m2
Land
638 m2
-Sols
2025-02-26
230 000 
Sale
Land
2366 m2
-Terrains à bâtir
2025-02-14
205 000 
Sale
Land
612 m2
-Terrains à bâtir
2025-02-12
175 000 
Sale
Land
660 m2
-Terrains d'agrément
2024-12-30
1 300 
Sale
Land
2831 m2
-Terrains d'agrément
2024-12-21
150 000 
2 206  /m²(68 m²)
Sale
Houses
House
1 room
68 m2
Land
353 m2
-Sols
2024-12-20
168 000 
Sale
Land
1001 m2
-Terres
2024-12-14
23 000 
Sale
Land
1044 m2
-Prés
2024-12-11
164 000 
Sale
Land
1000 m2
-Terres
2024-12-06
70 000 
2 188  /m²(32 m²)
Sale
Houses
House
2 rooms
32 m2
Land
161 m2
-Sols
2024-12-02
250 000 
1 953  /m²(128 m²)
Sale
Houses
House
1 room
30 m2
Houses
House
5 rooms
98 m2
Land
642 m2
-Sols
2024-11-27
1 
Sale
Land
1837 m2
-Sols
2024-11-27
132 600 
Sale
Land
708 m2
-Terres
2024-11-08
178 000 
1 978  /m²(90 m²)
Sale
Houses
House
3 rooms
90 m2
1 outbuilding
Land
61 m2
-Sols
2024-10-30
318 000 
3 975  /m²(80 m²)
Sale
Houses
House
4 rooms
80 m2
1 outbuilding
Land
973 m2
-Sols
2024-10-25
245 900 
2 049  /m²(120 m²)
Sale
Land
12 m2
-Sols
Land
1 m2
-Sols
Houses
House
4 rooms
120 m2
Land
346 m2
-Sols
2024-10-24
2 000 
Exchange
Land
12 m2
-Sols
Land
1 m2
-Sols
Land
27 m2
-Sols
Land
1 m2
-Sols
Land
1 m2
-Sols
2024-10-11
289 350 
3 617  /m²(80 m²)
Sale
Houses
House
3 rooms
80 m2
2 outbuildings
Land
603 m2
-Sols
526 transactions listed in the municipality

Calvados (14)

Most expensive cities

City
name
Descending orderHouses
house
Price per m²
6 297 
5 823 
5 346 
5 102 
5 042 
5 040 
4 875 
City
name
Descending orderApartments
apt.
Price per m²
6 532 
6 000 
5 056 
4 667 
4 332 
4 307 
4 287 

Least expensive cities

City
name
Ascending orderHouses
house
Price per m²
643 
948 
960 
968 
City
name
Ascending orderApartments
apt.
Price per m²
407 
545 
556