Median price of real estate
in the municipality of Saint-Vigor-le-Grand
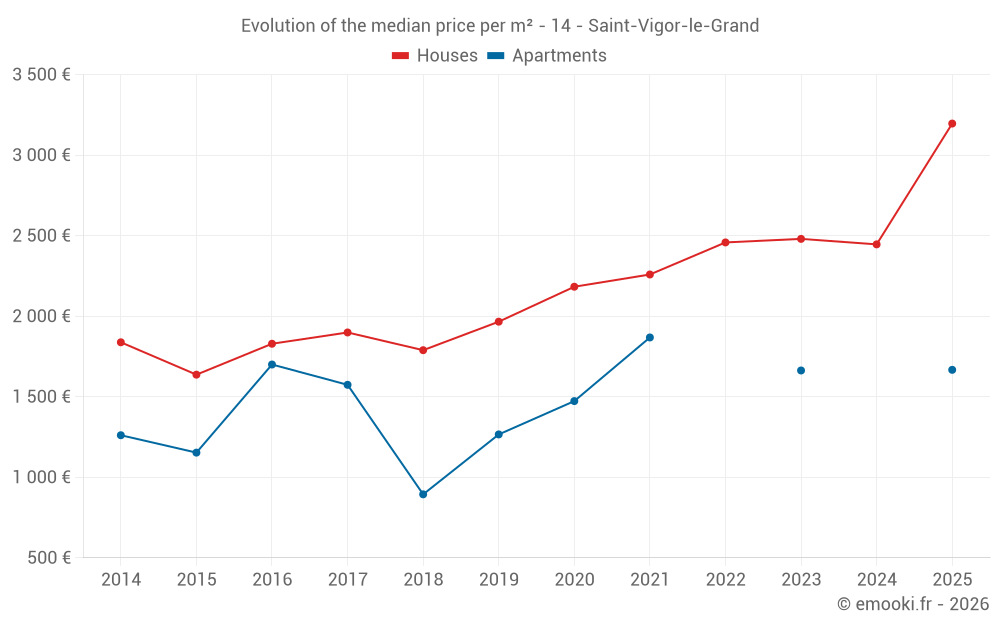
Houses
2 487 € /m²
Reliability 7/10
Median price on the 36 transactions of the last 24 months.
from 2 056 to
3 196 € /m²
3 196 € /m²
60% of transactions from the 2nd to the 8th deciles.
Apartments
1 665 € /m²
Reliability 3/10
Median price on the 8 transactions of the last 72 months.
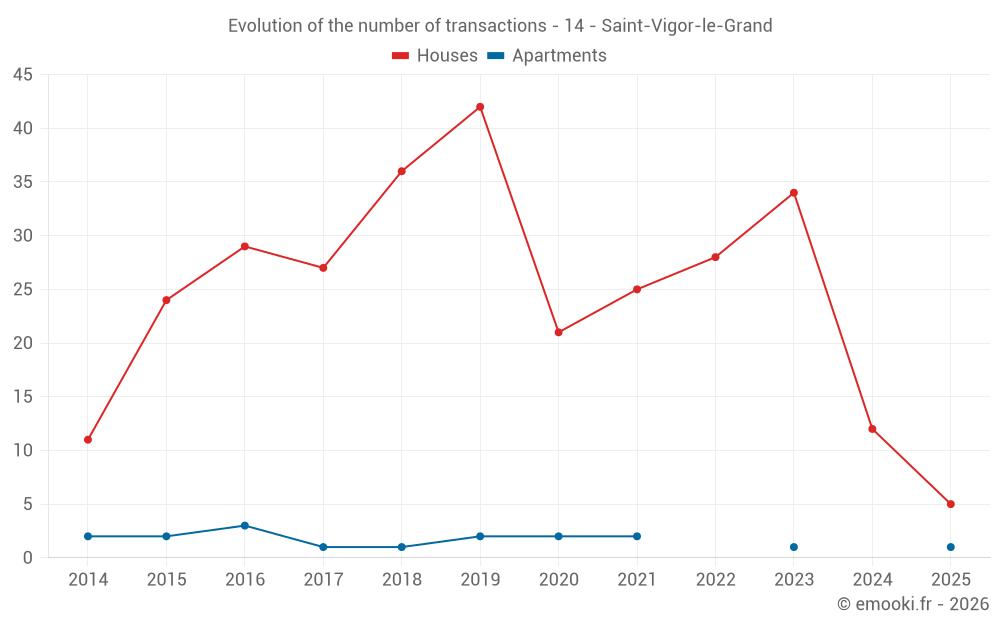
Dwellings
2 446 € /m²
Reliability 7/10
Median price on the 38 transactions of the last 24 months.
from 1 816 to
3 193 € /m²
3 193 € /m²
60% of transactions from the 2nd to the 8th deciles.