emooki
HomePrice mapTransactions
🇬🇧 English🇫🇷 Français🇩🇪 Deutsch🇪🇸 Español🇮🇹 Italiano

Real estate price map


Real estate price map in the municipality of Castine-en-Plaine, choose a section to see transactions by parcel.

Calvados (14)

Castine-en-Plaine - Real estate price m²

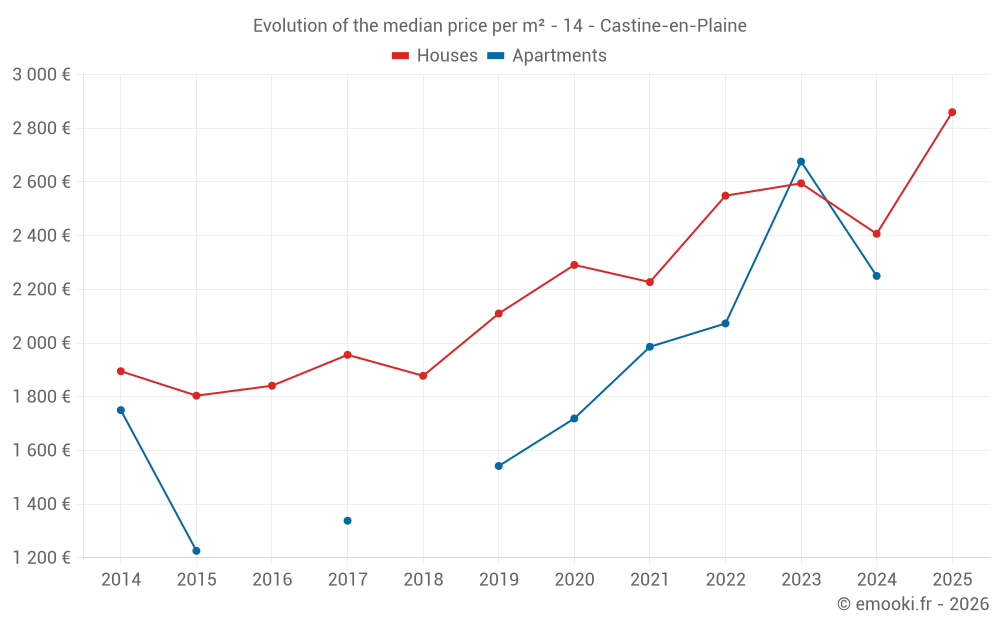
Median price of real estate
in the municipality of Castine-en-Plaine

HousesHouses
2 688  /m²
1-23-45-67-89-10
Reliability 8/10
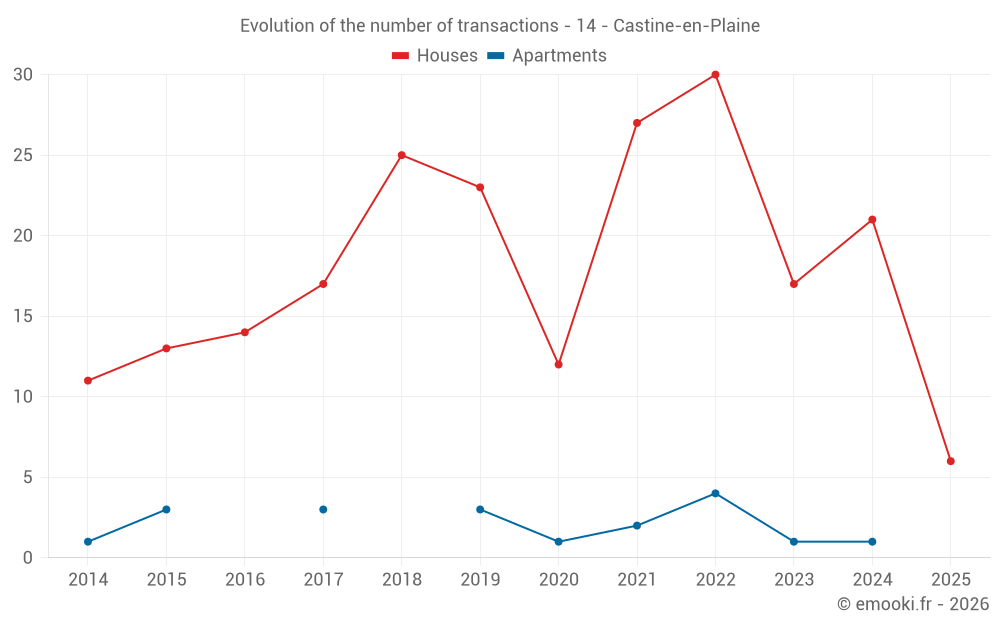
Median price on the 18 transactions of the last 12 months.
from 1 945 to
3 032  /m²
60% of transactions from the 2nd to the 8th deciles.
ApartmentsApartments
2 098  /m²
1-23-45-67-89-10
Reliability 4/10
Median price on the 9 transactions of the last 60 months.
DwellingsDwellings
2 653  /m²
1-23-45-67-89-10
Reliability 8/10
Median price on the 19 transactions of the last 12 months.
from 2 002 to
3 025  /m²
60% of transactions from the 2nd to the 8th deciles.
HousesEvolution of the price per m² of houses since...
1 year
+19%
2 years
+10%
3 years
+12%
4 years
+28%
5 years
+25%
6 years
+36%
7 years
+52%
8 years
+46%
9 years
+55%
10 years
+59%
11 years
+51%

Yearly evolution

Evolution of the median price per m²

Evolution of the median price per m² - 14 - Castine-en-Plaine

Evolution of the number of transactions

Warning, last year incomplete. Projections made based on the proportions between semesters of the previous year at the departmental/national level and by type of property.

Evolution of the number of transactions - 14 - Castine-en-Plaine

Yearly data

Descending order
Year
Houses
house
transactions
Houses
house
Price per m²
Apartments
apt.
transactions
Apartments
apt.
Price per m²
2025
6
2 860 
0
--- 
2024
21
2 407 
1
2 250 
2023
17
2 595 
1
2 676 
2022
30
2 549 
4
2 073 
2021
27
2 227 
2
1 986 
2020
12
2 291 
1
1 719 
2019
23
2 110 
3
1 542 
2018
25
1 878 
0
--- 
2017
17
1 956 
3
1 338 
2016
14
1 841 
0
--- 
2015
13
1 804 
3
1 226 
2014
11
1 895 
1
1 750 

Analysis

Structure of prices per m²

Values of price percentiles per m² over the periods used for the estimated price of each type of property.

Structure of transaction amounts

Values of transaction amounts percentiles over the periods used for the estimated price of each type of property.

Transaction amounts and prices per m² by percentile

Ascending order
Percentile
Houses
house
Price per m²
Houses
house
Transaction amount
Apartments
apt.
Price per m²
Apartments
apt.
Transaction amount
10th percentile
1 464 
172 K
1 792 
44 600 
20th percentile
1 945 
208 K
1 849 
66 000 
30th percentile
2 414 
243 K
1 944 
84 000 
40th percentile
2 613 
272 K
2 058 
91 000 
50th percentile
2 688 
295 K
2 098 
95 000 
60th percentile
2 756 
315 K
2 149 
98 200 
70th percentile
2 872 
317 K
2 215 
124 K
80th percentile
3 032 
342 K
2 300 
142 K
90th percentile
3 440 
357 K
2 435 
149 K

National and departmental comparison

Evolution of the median price per m² of houses

Evolution of the median price per m² of apartments

Quarterly evolution

Evolution of the median price per m²

Evolution of the number of transactions

Quarterly data

Descending order
Quarter
Houses
house
transactions
Houses
house
Price per m²
Apartments
apt.
transactions
Apartments
apt.
Price per m²
2025 Q2
4
3 080 
0
--- 
2025 Q1
2
2 749 
0
--- 
2024 Q4
9
2 407 
1
2 250 
2024 Q3
3
3 010 
0
--- 
2024 Q2
4
2 294 
0
--- 
2024 Q1
5
2 307 
0
--- 
2023 Q4
3
2 741 
0
--- 
2023 Q3
6
2 606 
0
--- 
2023 Q2
3
2 823 
0
--- 
2023 Q1
5
2 138 
1
2 676 
2022 Q4
7
2 641 
1
2 375 
2022 Q3
11
2 435 
1
1 875 
2022 Q2
8
2 686 
2
2 073 
2022 Q1
4
2 668 
0
--- 
2021 Q4
7
2 632 
0
--- 
2021 Q3
4
2 257 
0
--- 
2021 Q2
11
2 154 
2
1 986 
2021 Q1
5
2 212 
0
--- 
2020 Q4
6
2 230 
1
1 719 
2020 Q3
3
2 500 
0
--- 
2020 Q2
2
2 314 
0
--- 
2020 Q1
1
2 473 
0
--- 
2019 Q4
3
2 357 
1
1 528 
2019 Q3
9
1 942 
0
--- 
2019 Q2
8
2 171 
0
--- 
2019 Q1
3
1 831 
2
1 612 
2018 Q4
5
2 092 
0
--- 
2018 Q3
7
1 874 
0
--- 
2018 Q2
4
1 873 
0
--- 
2018 Q1
9
1 878 
0
--- 
2017 Q4
2
2 006 
0
--- 
2017 Q3
10
1 998 
1
1 641 
2017 Q2
2
1 700 
2
1 248 
2017 Q1
3
1 928 
0
--- 
2016 Q4
3
1 723 
0
--- 
2016 Q3
6
1 830 
0
--- 
2016 Q2
3
1 819 
0
--- 
2016 Q1
2
2 680 
0
--- 
2015 Q4
0
--- 
1
1 111 
2015 Q3
7
1 830 
0
--- 
2015 Q2
6
1 700 
1
1 451 
2015 Q1
0
--- 
1
1 226 
2014 Q4
1
1 858 
0
--- 
2014 Q3
3
1 670 
0
--- 
2014 Q2
3
1 963 
0
--- 
2014 Q1
4
1 986 
1
1 750 

Overview of the latest real estate transactions

The following list is an anonymized overview of the latest transactions. For more details and to find all transactions, please use the map to view transactions by plot or the transaction search page for a search by criteria.

2025-06-10
316 300 
2 875  /m²(110 m²)
Sale
Houses
House
4 rooms
110 m2
Land
483 m2
-Sols
2025-05-13
623 818 
539  /m²(1158 m²)
Sale
Commercial property
300 m2
Commercial property
858 m2
Land
7142 m2
-Sols
Land
2885 m2
-Sols
Land
209 m2
-Terrains à bâtir
Land
325 m2
-Terrains à bâtir
Land
108 m2
-Terrains à bâtir
Land
15159 m2
-Sols
Land
10697 m2
-Sols
Land
1709 m2
-Sols
Land
17135 m2
-Sols
Land
724 m2
-Terres
Land
266 m2
-Sols
Land
573 m2
-Terres
Land
380 m2
-Sols
Land
2307 m2
-Sols
Land
1689 m2
-Sols
Land
303 m2
-Sols
Land
1634 m2
-Sols
Land
136 m2
-Sols
Land
9923 m2
-Sols
Land
353 m2
-Prés
Land
558 m2
-Terres
Land
800 m2
-Terres
Land
3854 m2
-Terres
Land
9001 m2
-Terres
Land
210 m2
-Sols
Land
3364 m2
-Sols
Land
440 m2
-Sols
Land
1270 m2
-Terres
Land
861 m2
-Sols
Land
198 m2
-Sols
Land
12 m2
-Sols
Land
1989 m2
-Sols
Land
25 m2
-Terres
Land
986 m2
-Terres
Land
901 m2
-Sols
Land
690 m2
-Sols
Land
1962 m2
-Sols
Land
188 m2
-Sols
Land
3077 m2
-Sols
Land
49 m2
-Sols
Land
742 m2
-Sols
Land
199 m2
-Sols
Land
34104 m2
-Landes
Land
77 m2
-Terres
Land
8927 m2
-Terres
Land
9128 m2
-Terres
Land
9024 m2
-Terres
Land
22222 m2
-Terres
Land
22200 m2
-Terres
Land
1390 m2
-Terrains d'agrément
2025-04-28
257 500 
Sale
Land
3 m2
-Terrains à bâtir
Land
18 m2
-Terrains à bâtir
Land
12 m2
-Terrains à bâtir
Land
13 m2
-Terrains à bâtir
Land
299 m2
-Terrains à bâtir
Land
183 m2
-Terrains à bâtir
2025-04-23
380 000 
3 800  /m²(100 m²)
Sale
Houses
House
4 rooms
100 m2
Land
175 m2
-Sols
Land
500 m2
-Sols
Land
539 m2
-Jardins
Land
38 m2
-Sols
2025-04-14
279 320 
3 286  /m²(85 m²)
Sale
Houses
House
4 rooms
85 m2
Land
386 m2
-Sols
2025-04-14
182 000 
1 213  /m²(150 m²)
Sale
Houses
House
5 rooms
150 m2
Land
541 m2
-Sols
2025-03-25
245 000 
Sale
Land
13 m2
-Terrains à bâtir
Land
13 m2
-Terrains à bâtir
Land
299 m2
-Terrains à bâtir
Land
128 m2
-Terrains à bâtir
2025-02-24
310 400 
2 653  /m²(117 m²)
Sale
Houses
House
6 rooms
117 m2
Land
734 m2
-Sols
2025-01-31
330 000 
2 845  /m²(116 m²)
Sale
Houses
House
5 rooms
116 m2
Land
454 m2
-Sols
2024-12-26
242 000 
1 833  /m²(132 m²)
Sale
Houses
House
6 rooms
132 m2
Land
500 m2
-Sols
Land
855 m2
-Terrains d'agrément
2024-12-23
150 000 
926  /m²(162 m²)
Sale
Houses
House
6 rooms
162 m2
Land
992 m2
-Sols
2024-12-23
5 316 
Sale
Land
3185 m2
-Sols
Land
2131 m2
-Sols
2024-12-19
276 970 
2 114  /m²(131 m²)
Sale
Houses
House
7 rooms
131 m2
1 outbuilding
Land
797 m2
-Sols
2024-12-19
254 000 
2 646  /m²(96 m²)
Sale
Houses
House
5 rooms
96 m2
2024-12-05
363 600 
2 734  /m²(133 m²)
Sale
Houses
House
4 rooms
133 m2
Land
513 m2
-Sols
Land
558 m2
-Sols
2024-11-18
317 600 
2 481  /m²(128 m²)
Sale
Houses
House
5 rooms
128 m2
Land
522 m2
-Sols
2024-11-15
314 100 
5 235  /m²(60 m²)
Sale
Houses
House
3 rooms
60 m2
2 outbuildings
Land
399 m2
-Sols
2024-10-31
90 000 
2 250  /m²(40 m²)
Sale
Apartments
Apartment
3 rooms
40 m2
2 outbuildings
2024-10-25
110 000 
1 571  /m²(70 m²)
Sale
Houses
House
2 rooms
70 m2
2024-10-01
228 650 
2 407  /m²(95 m²)
Sale
Houses
House
4 rooms
95 m2
Land
341 m2
-Sols
432 transactions listed in the municipality

Calvados (14)

Most expensive cities

City
name
Descending orderHouses
house
Price per m²
6 297 
5 823 
5 346 
5 102 
5 042 
5 040 
4 875 
City
name
Descending orderApartments
apt.
Price per m²
6 532 
6 000 
5 056 
4 667 
4 332 
4 307 
4 287 

Least expensive cities

City
name
Ascending orderHouses
house
Price per m²
643 
948 
960 
968 
City
name
Ascending orderApartments
apt.
Price per m²
407 
545 
556