emooki
HomePrice mapTransactions
🇬🇧 English🇫🇷 Français🇩🇪 Deutsch🇪🇸 Español🇮🇹 Italiano

Real estate price map


Real estate price map in the municipality of Orbec, choose a section to see transactions by parcel.

Calvados (14)

Orbec - Real estate price m²

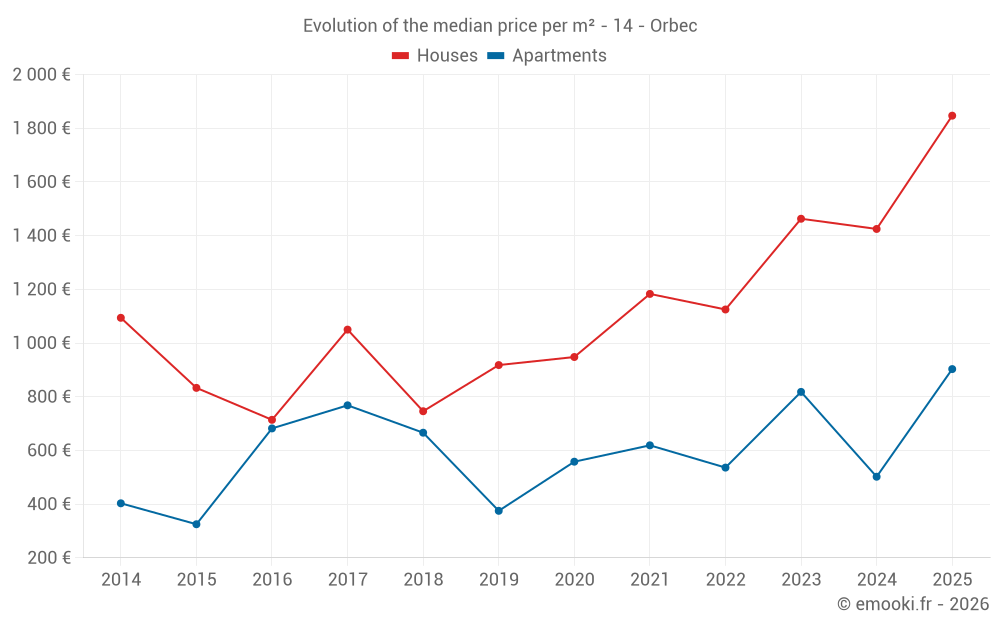
Median price of real estate
in the municipality of Orbec

HousesHouses
1 505  /m²
1-23-45-67-89-10
Reliability 8/10
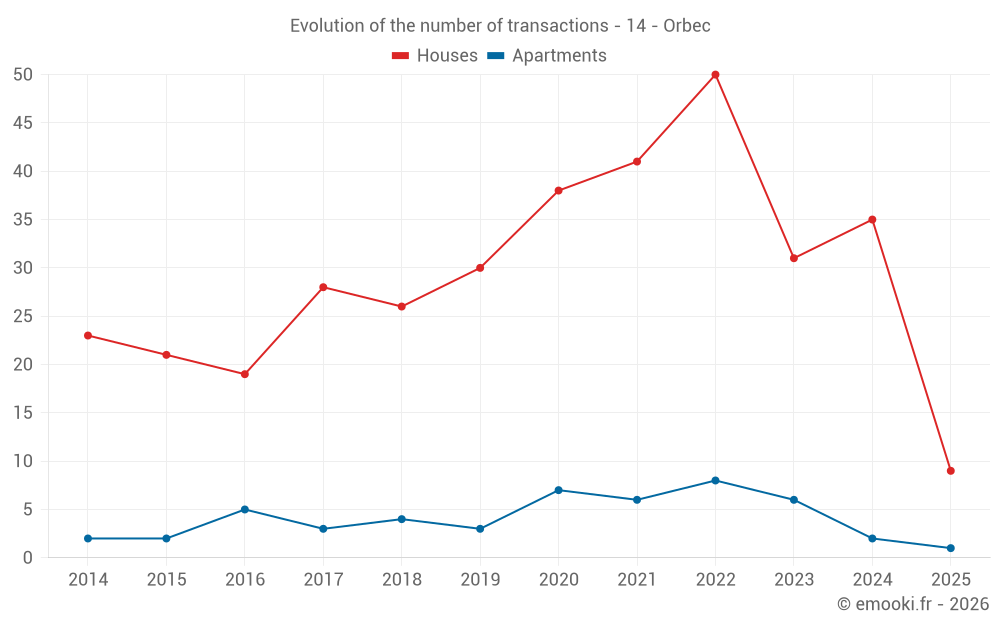
Median price on the 30 transactions of the last 12 months.
from 1 132 to
2 144  /m²
60% of transactions from the 2nd to the 8th deciles.
ApartmentsApartments
817  /m²
1-23-45-67-89-10
Reliability 6/10
Median price on the 13 transactions of the last 36 months.
from 444 to
1 131  /m²
60% of transactions from the 2nd to the 8th deciles.
DwellingsDwellings
1 461  /m²
1-23-45-67-89-10
Reliability 8/10
Median price on the 32 transactions of the last 12 months.
from 1 007 to
2 061  /m²
60% of transactions from the 2nd to the 8th deciles.
HousesEvolution of the price per m² of houses since...
1 year
+30%
2 years
+26%
3 years
+64%
4 years
+56%
5 years
+95%
6 years
+101%
7 years
+148%
8 years
+76%
9 years
+159%
10 years
+122%
11 years
+69%

Yearly evolution

Evolution of the median price per m²

Evolution of the median price per m² - 14 - Orbec

Evolution of the number of transactions

Warning, last year incomplete. Projections made based on the proportions between semesters of the previous year at the departmental/national level and by type of property.

Evolution of the number of transactions - 14 - Orbec

Yearly data

Descending order
Year
Houses
house
transactions
Houses
house
Price per m²
Apartments
apt.
transactions
Apartments
apt.
Price per m²
2025
9
1 847 
1
903 
2024
35
1 425 
2
502 
2023
31
1 463 
6
818 
2022
50
1 125 
8
536 
2021
41
1 183 
6
619 
2020
38
948 
7
558 
2019
30
918 
3
375 
2018
26
746 
4
666 
2017
28
1 050 
3
768 
2016
19
714 
5
682 
2015
21
833 
2
325 
2014
23
1 094 
2
403 

Analysis

Structure of prices per m²

Values of price percentiles per m² over the periods used for the estimated price of each type of property.

Structure of transaction amounts

Values of transaction amounts percentiles over the periods used for the estimated price of each type of property.

Transaction amounts and prices per m² by percentile

Ascending order
Percentile
Houses
house
Price per m²
Houses
house
Transaction amount
Apartments
apt.
Price per m²
Apartments
apt.
Transaction amount
10th percentile
961 
59 400 
387 
27 000 
20th percentile
1 132 
74 000 
444 
36 200 
30th percentile
1 212 
83 200 
570 
49 701 
40th percentile
1 419 
89 200 
669 
63 500 
50th percentile
1 505 
115 K
817 
74 000 
60th percentile
1 705 
137 K
837 
77 720 
70th percentile
1 855 
160 K
963 
84 600 
80th percentile
2 144 
196 K
1 131 
94 800 
90th percentile
2 381 
252 K
1 223 
99 600 

National and departmental comparison

Evolution of the median price per m² of houses

Evolution of the median price per m² of apartments

Quarterly evolution

Evolution of the median price per m²

Evolution of the number of transactions

Quarterly data

Descending order
Quarter
Houses
house
transactions
Houses
house
Price per m²
Apartments
apt.
transactions
Apartments
apt.
Price per m²
2025 Q2
2
1 928 
1
903 
2025 Q1
7
1 847 
0
--- 
2024 Q4
11
1 429 
0
--- 
2024 Q3
10
1 459 
1
329 
2024 Q2
5
1 190 
0
--- 
2024 Q1
9
1 316 
1
676 
2023 Q4
6
1 521 
1
817 
2023 Q3
12
1 474 
0
--- 
2023 Q2
2
1 491 
3
643 
2023 Q1
11
1 385 
2
1 002 
2022 Q4
7
1 828 
1
433 
2022 Q3
15
1 000 
3
1 233 
2022 Q2
10
1 318 
3
217 
2022 Q1
18
1 192 
1
687 
2021 Q4
15
1 391 
1
1 045 
2021 Q3
8
672 
2
440 
2021 Q2
8
1 377 
3
762 
2021 Q1
10
556 
0
--- 
2020 Q4
10
1 288 
3
590 
2020 Q3
10
588 
4
526 
2020 Q2
11
1 192 
0
--- 
2020 Q1
7
600 
0
--- 
2019 Q4
10
918 
0
--- 
2019 Q3
8
943 
1
375 
2019 Q2
6
1 030 
2
574 
2019 Q1
6
902 
0
--- 
2018 Q4
8
936 
1
376 
2018 Q3
8
718 
2
594 
2018 Q2
2
576 
1
957 
2018 Q1
8
804 
0
--- 
2017 Q4
10
668 
0
--- 
2017 Q3
9
988 
1
792 
2017 Q2
5
1 345 
0
--- 
2017 Q1
4
1 596 
2
704 
2016 Q4
3
714 
2
555 
2016 Q3
4
838 
0
--- 
2016 Q2
5
689 
1
1 159 
2016 Q1
7
1 000 
2
693 
2015 Q4
8
1 017 
1
200 
2015 Q3
4
686 
1
450 
2015 Q2
6
988 
0
--- 
2015 Q1
3
709 
0
--- 
2014 Q4
5
1 297 
1
306 
2014 Q3
10
1 010 
0
--- 
2014 Q2
3
577 
1
500 
2014 Q1
5
1 453 
0
--- 

Overview of the latest real estate transactions

The following list is an anonymized overview of the latest transactions. For more details and to find all transactions, please use the map to view transactions by plot or the transaction search page for a search by criteria.

2025-05-23
3 200 
Sale
Land
33 m2
-Sols
2025-05-21
9 500 
Sale
1 outbuilding
2025-04-10
130 000 
903  /m²(144 m²)
Sale
Apartments
Apartment
3 rooms
42 m2
Apartments
Apartment
2 rooms
32 m2
Apartments
Apartment
2 rooms
35 m2
Apartments
Apartment
2 rooms
35 m2
4 outbuildings
Land
324 m2
-Sols
2025-04-10
171 500 
2 638  /m²(65 m²)
Sale
Houses
House
3 rooms
65 m2
Land
265 m2
-Terrains d'agrément
Land
500 m2
-Sols
2025-04-02
140 000 
1 217  /m²(115 m²)
Sale
Houses
House
5 rooms
115 m2
4 outbuildings
Land
500 m2
-Sols
Land
563 m2
-Terrains d'agrément
2025-03-28
20 000 
Sale
Land
100 m2
-Sols
2025-03-24
140 000 
2 333  /m²(60 m²)
Sale
Land
221 m2
-Sols
Houses
House
4 rooms
60 m2
Land
244 m2
-Sols
2025-03-07
130 000 
2 097  /m²(62 m²)
Sale
Houses
House
4 rooms
62 m2
Land
585 m2
-Sols
2025-02-22
100 000 
2 439  /m²(41 m²)
Sale
Houses
House
4 rooms
41 m2
1 outbuilding
Land
87 m2
-Sols
2025-02-18
85 000 
1 133  /m²(75 m²)
Sale
Houses
House
4 rooms
75 m2
Land
81 m2
-Sols
2025-01-30
247 500 
1 847  /m²(134 m²)
Sale
Houses
House
7 rooms
134 m2
2 outbuildings
Land
292 m2
-Jardins
/Jardin potager
2025-01-29
40 000 
930  /m²(43 m²)
Sale
Houses
House
3 rooms
43 m2
1 outbuilding
1 outbuilding
Land
21 m2
-Sols
2025-01-22
73 000 
427  /m²(171 m²)
521  /m²(140 m²)
Sale
Apartments
Apartment
2 rooms
70 m2
Apartments
Apartment
2 rooms
70 m2
Commercial property
31 m2
Land
76 m2
-Sols
2025-01-16
1 
Sale
Land
20 m2
-Sols
2025-01-16
135 000 
1 667  /m²(81 m²)
Sale
Houses
House
3 rooms
40 m2
2 outbuildings
Land
114 m2
-Sols
Land
2 m2
-Sols
Houses
House
3 rooms
41 m2
1 outbuilding
Land
127 m2
-Sols
Land
1 m2
-Sols
Land
12 m2
-Sols
Land
343 m2
-Jardins
/Jardin potager
Land
1894 m2
-Prés plantes
Land
1894 m2
-Prés
Land
13 m2
-Sols
2024-12-20
280 000 
1 918  /m²(146 m²)
Sale
Houses
House
5 rooms
146 m2
2 outbuildings
Land
1000 m2
-Terrains d'agrément
Land
1102 m2
-Prés plantes
Land
500 m2
-Sols
2024-12-19
54 000 
964  /m²(56 m²)
Sale
Land
26 m2
-Sols
Houses
House
3 rooms
56 m2
Land
316 m2
-Sols
2024-12-17
266 000 
2 354  /m²(113 m²)
Sale
Houses
House
6 rooms
113 m2
1 outbuilding
Land
1855 m2
-Prés plantes
Land
1000 m2
-Sols
2024-12-10
75 600 
788  /m²(96 m²)
Sale
1 outbuilding
Land
18 m2
-Sols
Houses
House
4 rooms
96 m2
1 outbuilding
Land
186 m2
-Sols
2024-12-09
90 000 
375  /m²(240 m²)
563  /m²(160 m²)
Sale
Apartments
Apartment
2 rooms
40 m2
Apartments
Apartment
2 rooms
40 m2
Apartments
Apartment
2 rooms
40 m2
Apartments
Apartment
2 rooms
40 m2
Commercial property
80 m2
3 outbuildings
Land
190 m2
-Sols
589 transactions listed in the municipality

Calvados (14)

Most expensive cities

City
name
Descending orderHouses
house
Price per m²
6 297 
5 823 
5 346 
5 102 
5 042 
5 040 
4 875 
City
name
Descending orderApartments
apt.
Price per m²
6 532 
6 000 
5 056 
4 667 
4 332 
4 307 
4 287 

Least expensive cities

City
name
Ascending orderHouses
house
Price per m²
643 
948 
960 
968 
City
name
Ascending orderApartments
apt.
Price per m²
407 
545 
556