emooki
HomePrice mapTransactions
🇬🇧 English🇫🇷 Français🇩🇪 Deutsch🇪🇸 Español🇮🇹 Italiano

Real estate price map


Real estate price map in the municipality of Louvigny, choose a section to see transactions by parcel.

Calvados (14)

Louvigny - Real estate price m²

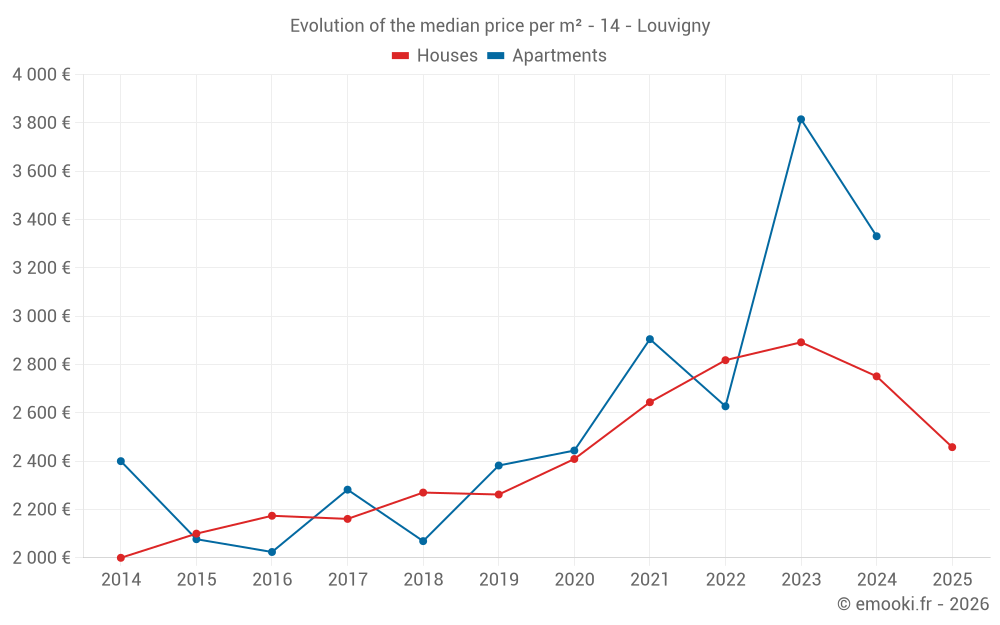
Median price of real estate
in the municipality of Louvigny

HousesHouses
2 744  /m²
1-23-45-67-89-10
Reliability 7/10
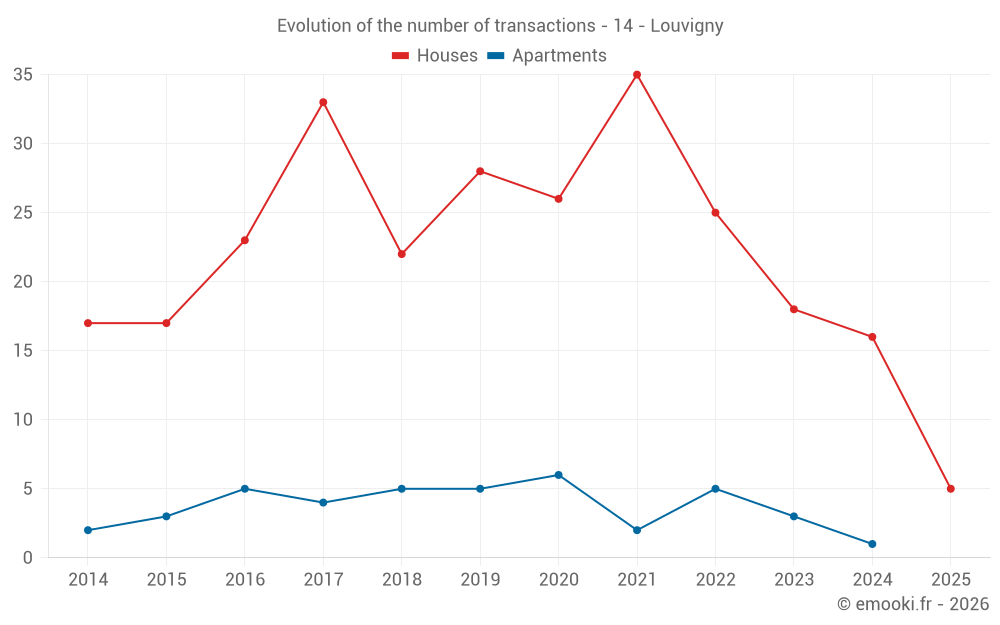
Median price on the 29 transactions of the last 24 months.
from 2 451 to
3 036  /m²
60% of transactions from the 2nd to the 8th deciles.
ApartmentsApartments
2 864  /m²
1-23-45-67-89-10
Reliability 4/10
Median price on the 13 transactions of the last 60 months.
from 2 301 to
3 599  /m²
60% of transactions from the 2nd to the 8th deciles.
DwellingsDwellings
2 792  /m²
1-23-45-67-89-10
Reliability 7/10
Median price on the 32 transactions of the last 24 months.
from 2 459 to
3 247  /m²
60% of transactions from the 2nd to the 8th deciles.
HousesEvolution of the price per m² of houses since...
1 year
-11%
2 years
-15%
3 years
-13%
4 years
-7%
5 years
+2%
6 years
+8.7%
7 years
+8.3%
8 years
+14%
9 years
+13%
10 years
+17%
11 years
+23%
The price per m² of houses has decreased by 15% since 2 years, but it has increased by 23% in 11 years.

Yearly evolution

Evolution of the median price per m²

Evolution of the median price per m² - 14 - Louvigny

Evolution of the number of transactions

Warning, last year incomplete. Projections made based on the proportions between semesters of the previous year at the departmental/national level and by type of property.

Evolution of the number of transactions - 14 - Louvigny

Yearly data

Descending order
Year
Houses
house
transactions
Houses
house
Price per m²
Apartments
apt.
transactions
Apartments
apt.
Price per m²
2025
5
2 458 
0
--- 
2024
16
2 751 
1
3 331 
2023
18
2 892 
3
3 815 
2022
25
2 818 
5
2 627 
2021
35
2 644 
2
2 905 
2020
26
2 409 
6
2 444 
2019
28
2 262 
5
2 382 
2018
22
2 270 
5
2 069 
2017
33
2 161 
4
2 282 
2016
23
2 174 
5
2 024 
2015
17
2 100 
3
2 077 
2014
17
2 000 
2
2 400 

Analysis

Structure of prices per m²

Values of price percentiles per m² over the periods used for the estimated price of each type of property.

Structure of transaction amounts

Values of transaction amounts percentiles over the periods used for the estimated price of each type of property.

Transaction amounts and prices per m² by percentile

Ascending order
Percentile
Houses
house
Price per m²
Houses
house
Transaction amount
Apartments
apt.
Price per m²
Apartments
apt.
Transaction amount
10th percentile
2 263 
174 K
2 072 
118 K
20th percentile
2 451 
213 K
2 301 
140 K
30th percentile
2 500 
229 K
2 541 
143 K
40th percentile
2 567 
244 K
2 676 
148 K
50th percentile
2 744 
256 K
2 864 
155 K
60th percentile
2 857 
277 K
3 087 
161 K
70th percentile
2 927 
304 K
3 311 
174 K
80th percentile
3 036 
339 K
3 599 
188 K
90th percentile
3 259 
379 K
3 807 
198 K

National and departmental comparison

Evolution of the median price per m² of houses

Evolution of the median price per m² of apartments

Quarterly evolution

Evolution of the median price per m²

Evolution of the number of transactions

Quarterly data

Descending order
Quarter
Houses
house
transactions
Houses
house
Price per m²
Apartments
apt.
transactions
Apartments
apt.
Price per m²
2025 Q2
5
2 458 
0
--- 
2024 Q4
5
2 758 
0
--- 
2024 Q3
5
2 500 
0
--- 
2024 Q2
3
3 004 
1
3 331 
2024 Q1
3
2 865 
0
--- 
2023 Q4
7
2 826 
1
3 298 
2023 Q3
1
2 896 
1
3 815 
2023 Q2
5
3 286 
0
--- 
2023 Q1
5
2 864 
1
6 552 
2022 Q4
7
2 925 
1
2 864 
2022 Q3
6
2 810 
0
--- 
2022 Q2
7
2 845 
1
1 386 
2022 Q1
5
2 083 
3
2 627 
2021 Q4
10
2 832 
0
--- 
2021 Q3
10
2 286 
0
--- 
2021 Q2
6
3 105 
1
3 777 
2021 Q1
9
2 439 
1
2 033 
2020 Q4
10
2 552 
0
--- 
2020 Q3
4
2 305 
2
2 458 
2020 Q2
6
2 376 
2
2 354 
2020 Q1
6
2 232 
2
2 256 
2019 Q4
8
2 274 
2
2 130 
2019 Q3
14
2 234 
0
--- 
2019 Q2
2
2 804 
2
2 471 
2019 Q1
4
2 366 
1
2 340 
2018 Q4
6
2 411 
0
--- 
2018 Q3
8
2 282 
1
2 069 
2018 Q2
5
1 931 
1
1 852 
2018 Q1
3
2 100 
3
2 387 
2017 Q4
7
2 138 
2
2 254 
2017 Q3
9
2 130 
0
--- 
2017 Q2
11
2 204 
0
--- 
2017 Q1
6
2 106 
2
2 430 
2016 Q4
4
2 186 
1
1 015 
2016 Q3
9
2 131 
3
2 024 
2016 Q2
5
2 174 
0
--- 
2016 Q1
5
2 466 
1
2 043 
2015 Q4
4
2 060 
1
2 221 
2015 Q3
7
2 013 
0
--- 
2015 Q2
4
2 476 
0
--- 
2015 Q1
2
1 796 
2
1 870 
2014 Q4
5
1 719 
1
2 553 
2014 Q3
7
2 000 
0
--- 
2014 Q2
2
1 859 
1
2 246 
2014 Q1
3
2 278 
0
--- 

Overview of the latest real estate transactions

The following list is an anonymized overview of the latest transactions. For more details and to find all transactions, please use the map to view transactions by plot or the transaction search page for a search by criteria.

2025-05-27
180 000 
2 118  /m²(85 m²)
Sale
Houses
House
4 rooms
85 m2
Land
688 m2
-Sols
2025-05-15
327 000 
2 920  /m²(112 m²)
Sale
Houses
House
6 rooms
112 m2
Land
521 m2
-Sols
Land
74 m2
-Sols
2025-04-30
300 500 
2 463  /m²(122 m²)
Sale
Houses
House
6 rooms
122 m2
Land
678 m2
-Sols
2025-04-30
295 000 
2 458  /m²(120 m²)
Sale
Houses
House
5 rooms
120 m2
1 outbuilding
Land
481 m2
-Sols
2025-04-23
204 000 
2 318  /m²(88 m²)
Sale
Houses
House
5 rooms
88 m2
Land
216 m2
-Sols
2025-04-08
250 000 
Sale
Land
204 m2
-Sols
2025-01-30
50 000 
Sale
Land
8019 m2
-Terres
Land
8018 m2
-Terres
Land
14715 m2
-Terres
2024-12-27
256 000 
3 084  /m²(83 m²)
Sale
Houses
House
5 rooms
83 m2
Land
173 m2
-Sols
2024-12-23
305 000 
2 243  /m²(136 m²)
Sale
Commercial property
136 m2
Land
727 m2
-Sols
2024-12-20
202 400 
2 108  /m²(96 m²)
Sale
Houses
House
5 rooms
96 m2
Land
337 m2
-Sols
2024-12-16
313 500 
2 986  /m²(105 m²)
Sale
Houses
House
4 rooms
105 m2
Land
164 m2
-Sols
2024-12-04
3 872 
Exchange
Land
1395 m2
-Prés
Land
687 m2
-Prés
Land
650 m2
-Sols
Land
1563 m2
-Sols
Land
101 m2
-Sols
Land
103 m2
-Sols
Land
94 m2
-Sols
Land
113 m2
-Sols
Land
173 m2
-Sols
Land
78 m2
-Sols
Land
169 m2
-Sols
Land
102 m2
-Sols
Land
135 m2
-Sols
Land
175 m2
-Sols
Land
1112 m2
-Sols
2024-11-26
375 090 
2 758  /m²(136 m²)
Sale
Houses
House
6 rooms
136 m2
Land
596 m2
-Sols
2024-11-13
1 
Sale
Land
8 m2
-Sols
2024-11-13
36 300 
Sale
Land
381 m2
-Sols
Land
49 m2
-Sols
2024-10-22
240 900 
2 563  /m²(94 m²)
Sale
Houses
House
5 rooms
94 m2
2024-09-23
265 000 
3 732  /m²(71 m²)
Sale
Land
253 m2
-Terrains d'agrément
Houses
House
3 rooms
71 m2
Land
614 m2
-Sols
2024-09-09
371 000 
2 441  /m²(152 m²)
Sale
Houses
House
5 rooms
152 m2
Land
608 m2
-Sols
2024-09-05
218 400 
2 299  /m²(95 m²)
Sale
Houses
House
5 rooms
95 m2
Land
520 m2
-Sols
2024-07-18
235 000 
2 582  /m²(91 m²)
Sale
Houses
House
4 rooms
70 m2
Houses
House
1 room
21 m2
2 outbuildings
Land
518 m2
-Sols
376 transactions listed in the municipality

Calvados (14)

Most expensive cities

City
name
Descending orderHouses
house
Price per m²
6 297 
5 823 
5 346 
5 102 
5 042 
5 040 
4 875 
City
name
Descending orderApartments
apt.
Price per m²
6 532 
6 000 
5 056 
4 667 
4 332 
4 307 
4 287 

Least expensive cities

City
name
Ascending orderHouses
house
Price per m²
643 
948 
960 
968 
City
name
Ascending orderApartments
apt.
Price per m²
407 
545 
556