emooki
HomePrice mapTransactions
🇬🇧 English🇫🇷 Français🇩🇪 Deutsch🇪🇸 Español🇮🇹 Italiano

Real estate price map


Real estate price map in the municipality of Blainville-sur-Orne, choose a section to see transactions by parcel.

Calvados (14)

Blainville-sur-Orne - Real estate price m²

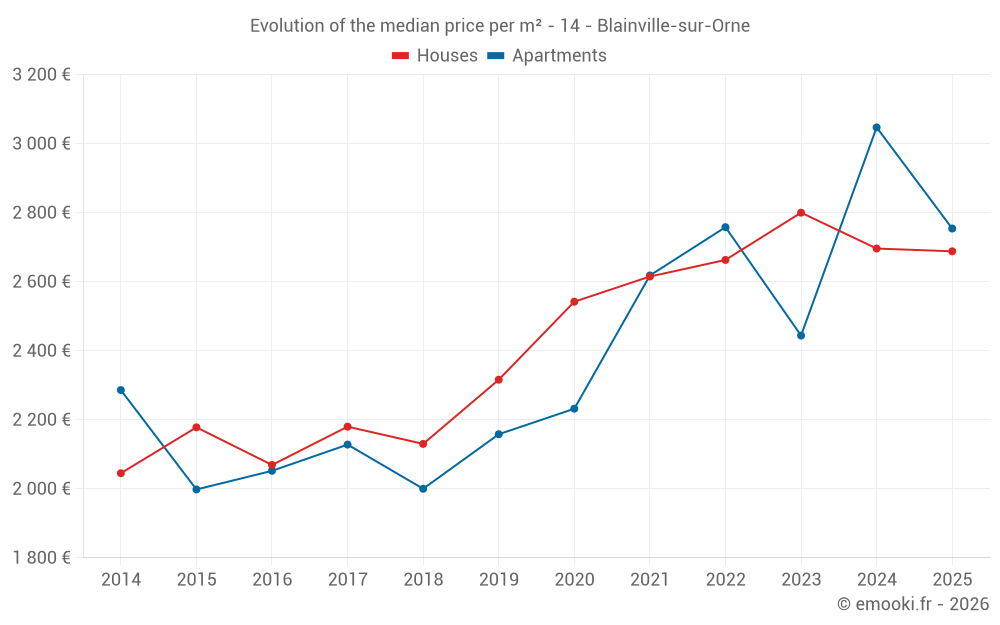
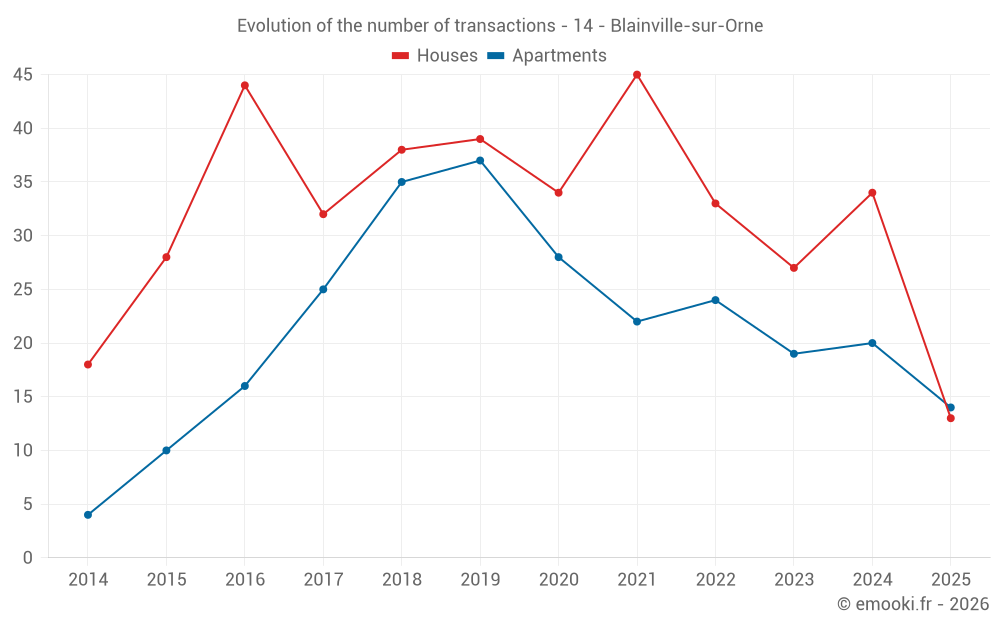
Median price of real estate
in the municipality of Blainville-sur-Orne

HousesHouses
2 736  /m²
1-23-45-67-89-10
Reliability 8/10
Median price on the 26 transactions of the last 12 months.
from 2 376 to
3 210  /m²
60% of transactions from the 2nd to the 8th deciles.
ApartmentsApartments
2 878  /m²
1-23-45-67-89-10
Reliability 8/10
Median price on the 26 transactions of the last 12 months.
from 2 267 to
3 295  /m²
60% of transactions from the 2nd to the 8th deciles.
DwellingsDwellings
2 688  /m²
1-23-45-67-89-10
Reliability 9/10
Median price on the 27 transactions of the last 6 months.
from 2 269 to
3 221  /m²
60% of transactions from the 2nd to the 8th deciles.
HousesEvolution of the price per m² of houses since...
1 year
-0.3%
2 years
-4%
3 years
+0.9%
4 years
+2.8%
5 years
+5.7%
6 years
+16%
7 years
+26%
8 years
+23%
9 years
+30%
10 years
+23%
11 years
+31%
The price per m² of houses has decreased by 4% since 2 years, but it has increased by 31% in 11 years.
ApartmentsEvolution of the price per m² of apartments since...
1 year
-10%
2 years
+13%
3 years
-0.1%
4 years
+5.2%
5 years
+23%
6 years
+28%
7 years
+38%
8 years
+29%
9 years
+34%
10 years
+38%
11 years
+20%
The price per m² of apartments has decreased by 10% since 1 year, but it has increased by 38% in 10 years.

Yearly evolution

Evolution of the median price per m²

Evolution of the median price per m² - 14 - Blainville-sur-Orne

Evolution of the number of transactions

Warning, last year incomplete. Projections made based on the proportions between semesters of the previous year at the departmental/national level and by type of property.

Evolution of the number of transactions - 14 - Blainville-sur-Orne

Yearly data

Descending order
Year
Houses
house
transactions
Houses
house
Price per m²
Apartments
apt.
transactions
Apartments
apt.
Price per m²
2025
13
2 688 
14
2 754 
2024
34
2 696 
20
3 047 
2023
27
2 800 
19
2 444 
2022
33
2 663 
24
2 758 
2021
45
2 615 
22
2 618 
2020
34
2 542 
28
2 232 
2019
39
2 316 
37
2 158 
2018
38
2 130 
35
2 000 
2017
32
2 180 
25
2 128 
2016
44
2 069 
16
2 052 
2015
28
2 178 
10
1 998 
2014
18
2 045 
4
2 286 

Analysis

Structure of prices per m²

Values of price percentiles per m² over the periods used for the estimated price of each type of property.

Structure of transaction amounts

Values of transaction amounts percentiles over the periods used for the estimated price of each type of property.

Transaction amounts and prices per m² by percentile

Ascending order
Percentile
Houses
house
Price per m²
Houses
house
Transaction amount
Apartments
apt.
Price per m²
Apartments
apt.
Transaction amount
10th percentile
2 206 
204 K
2 118 
109 K
20th percentile
2 376 
215 K
2 267 
125 K
30th percentile
2 504 
226 K
2 593 
130 K
40th percentile
2 566 
237 K
2 667 
141 K
50th percentile
2 736 
245 K
2 878 
154 K
60th percentile
2 929 
270 K
3 026 
175 K
70th percentile
2 954 
291 K
3 134 
182 K
80th percentile
3 210 
301 K
3 295 
192 K
90th percentile
3 412 
352 K
3 460 
215 K

National and departmental comparison

Evolution of the median price per m² of houses

Evolution of the median price per m² of apartments

Quarterly evolution

Evolution of the median price per m²

Evolution of the number of transactions

Quarterly data

Descending order
Quarter
Houses
house
transactions
Houses
house
Price per m²
Apartments
apt.
transactions
Apartments
apt.
Price per m²
2025 Q2
4
2 802 
8
2 878 
2025 Q1
9
2 590 
6
2 655 
2024 Q4
6
2 670 
9
3 026 
2024 Q3
7
2 784 
3
3 295 
2024 Q2
9
2 486 
6
3 210 
2024 Q1
12
2 904 
2
2 606 
2023 Q4
5
3 059 
3
1 893 
2023 Q3
9
2 945 
6
2 822 
2023 Q2
6
2 956 
3
2 444 
2023 Q1
7
2 624 
7
1 867 
2022 Q4
5
2 798 
6
2 734 
2022 Q3
12
2 486 
8
2 964 
2022 Q2
10
2 706 
4
1 920 
2022 Q1
6
2 574 
6
2 884 
2021 Q4
13
2 894 
6
2 668 
2021 Q3
10
2 686 
1
2 582 
2021 Q2
12
2 636 
9
2 681 
2021 Q1
10
2 116 
6
2 482 
2020 Q4
9
2 313 
13
2 232 
2020 Q3
8
2 586 
3
2 465 
2020 Q2
8
2 378 
5
1 825 
2020 Q1
9
2 575 
7
2 233 
2019 Q4
7
2 578 
9
2 117 
2019 Q3
14
2 300 
6
2 338 
2019 Q2
7
2 946 
12
2 215 
2019 Q1
11
2 229 
10
2 150 
2018 Q4
10
2 070 
7
2 000 
2018 Q3
14
2 182 
13
2 229 
2018 Q2
10
2 126 
10
1 307 
2018 Q1
4
2 014 
5
2 217 
2017 Q4
5
2 763 
6
1 834 
2017 Q3
13
2 001 
9
2 128 
2017 Q2
6
2 610 
6
2 280 
2017 Q1
8
2 122 
4
1 973 
2016 Q4
13
2 169 
5
1 844 
2016 Q3
18
1 890 
3
1 928 
2016 Q2
5
2 079 
5
2 158 
2016 Q1
8
2 052 
3
2 021 
2015 Q4
9
1 962 
3
1 974 
2015 Q3
11
2 139 
3
2 025 
2015 Q2
6
2 451 
1
1 841 
2015 Q1
2
2 266 
3
2 023 
2014 Q4
1
851 
0
--- 
2014 Q3
4
2 122 
2
2 286 
2014 Q2
6
2 045 
1
2 072 
2014 Q1
7
2 145 
1
2 895 

Overview of the latest real estate transactions

The following list is an anonymized overview of the latest transactions. For more details and to find all transactions, please use the map to view transactions by plot or the transaction search page for a search by criteria.

2025-06-30
174 900 
2 915  /m²(60 m²)
Sale
1 outbuilding
Apartments
Apartment
3 rooms
60 m2
1 outbuilding
2025-06-23
1 597 533 
Sale
Land
83 m2
-Terrains à bâtir
Land
166 m2
-Terrains à bâtir
Land
217 m2
-Terrains à bâtir
Land
166 m2
-Terrains à bâtir
Land
220 m2
-Terrains à bâtir
Land
101 m2
-Terrains à bâtir
Land
136 m2
-Terrains à bâtir
Land
224 m2
-Terrains à bâtir
Land
54 m2
-Terrains à bâtir
Land
3 m2
-Terrains à bâtir
2025-06-04
310 000 
3 605  /m²(86 m²)
Sale
Houses
House
3 rooms
86 m2
Land
649 m2
-Sols
2025-04-30
914 520 
Sale
Land
4281 m2
-Terrains à bâtir
2025-04-28
56 000 
778  /m²(72 m²)
Sale
Apartments
Apartment
3 rooms
72 m2
1 outbuilding
1 outbuilding
2025-04-24
200 000 
3 226  /m²(62 m²)
Sale
Apartments
Apartment
3 rooms
62 m2
1 outbuilding
2025-04-22
215 000 
2 688  /m²(80 m²)
Sale
Houses
House
4 rooms
80 m2
Land
260 m2
-Sols
2025-04-17
125 000 
2 841  /m²(44 m²)
Sale
Apartments
Apartment
2 rooms
44 m2
2 outbuildings
2025-04-17
230 000 
2 277  /m²(101 m²)
Sale
Houses
House
6 rooms
101 m2
Land
497 m2
-Sols
2025-04-17
218 000 
3 516  /m²(62 m²)
Sale
Apartments
Apartment
3 rooms
62 m2
2 outbuildings
2025-04-14
128 000 
3 368  /m²(38 m²)
Sale
Apartments
Apartment
2 rooms
38 m2
1 outbuilding
2025-04-09
141 100 
2 045  /m²(69 m²)
Sale
Apartments
Apartment
3 rooms
69 m2
2025-04-03
84 000 
Sale
Land
431 m2
-Terrains à bâtir
2025-04-02
166 900 
2 225  /m²(75 m²)
Sale
Apartments
Apartment
4 rooms
75 m2
1 outbuilding
2025-04-01
385 000 
2 917  /m²(132 m²)
Sale
Houses
House
5 rooms
132 m2
Land
439 m2
-Sols
2025-03-27
102 000 
2 267  /m²(45 m²)
Sale
Apartments
Apartment
2 rooms
45 m2
1 outbuilding
2025-03-25
45 830 
Sale
Commercial property
Commercial property
Land
14614 m2
-Sols
Land
658 m2
-Sols
Land
81 m2
-Terrains à bâtir
Land
157 m2
-Sols
Land
13257 m2
-Sols
Land
4625 m2
-Sols
Land
365 m2
-Sols
Land
140 m2
-Sols
Land
278 m2
-Sols
Land
253 m2
-Sols
Land
283 m2
-Sols
Land
96 m2
-Terrains à bâtir
Land
6909 m2
-Terrains à bâtir
Land
4113 m2
-Sols
2025-03-05
291 900 
3 243  /m²(90 m²)
Sale
Houses
House
5 rooms
90 m2
1 outbuilding
Land
338 m2
-Sols
2025-02-28
235 000 
2 136  /m²(110 m²)
Sale
Houses
House
3 rooms
110 m2
2025-02-27
131 200 
2 343  /m²(56 m²)
Sale
Apartments
Apartment
2 rooms
56 m2
1 outbuilding
1 outbuilding
1363 transactions listed in the municipality

Calvados (14)

Most expensive cities

City
name
Descending orderHouses
house
Price per m²
6 297 
5 823 
5 346 
5 102 
5 042 
5 040 
4 875 
City
name
Descending orderApartments
apt.
Price per m²
6 532 
6 000 
5 056 
4 667 
4 332 
4 307 
4 287 

Least expensive cities

City
name
Ascending orderHouses
house
Price per m²
643 
948 
960 
968 
City
name
Ascending orderApartments
apt.
Price per m²
407 
545 
556