emooki
HomePrice mapTransactions
🇬🇧 English🇫🇷 Français🇩🇪 Deutsch🇪🇸 Español🇮🇹 Italiano

Real estate price map


Real estate price map in the municipality of Fontiers-Cabardès.

Aude (11)
Fontiers-Cabardès

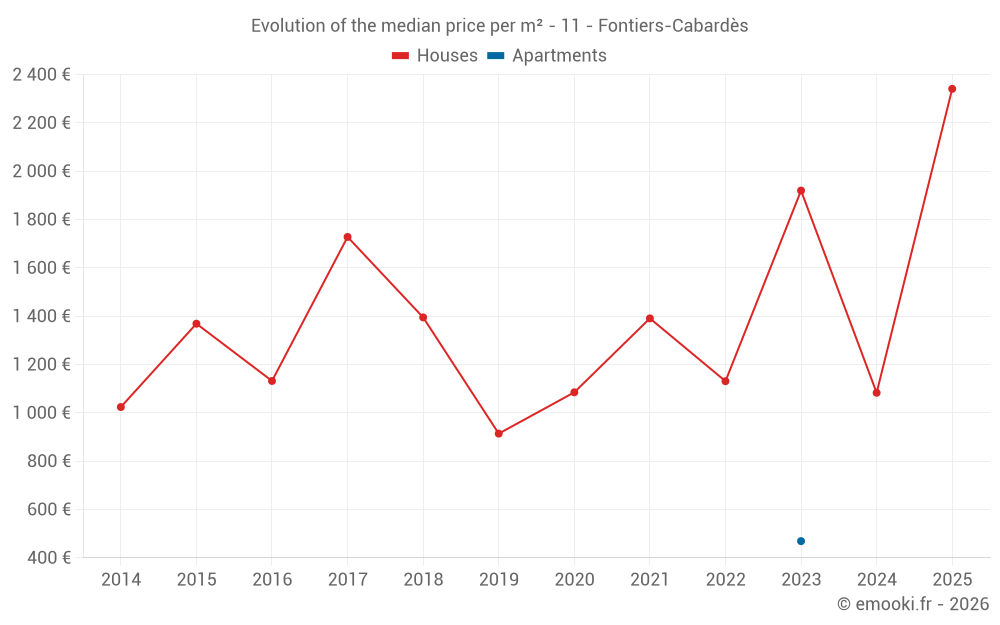
Median price of real estate
in the municipality of Fontiers-Cabardès

HousesHouses
1 221  /m²
1-23-45-67-89-10
Reliability 6/10
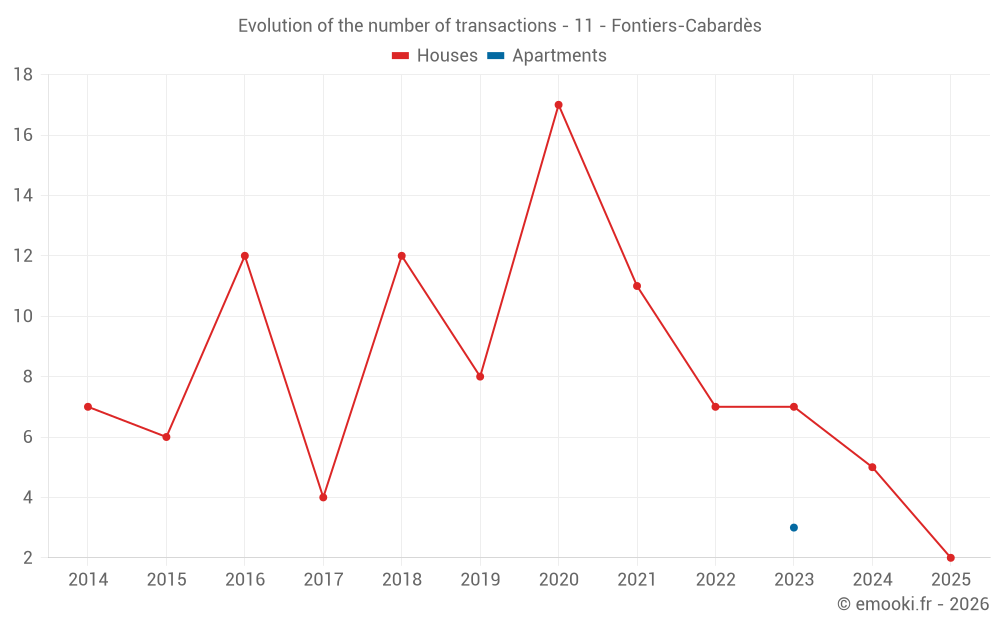
Median price on the 19 transactions of the last 36 months.
from 769 to
2 078  /m²
60% of transactions from the 2nd to the 8th deciles.
ApartmentsApartments
469  /m²
1-23-45-67-89-10
Reliability 1/10
Median price on the 3 transactions of the last 120 months.
DwellingsDwellings
1 107  /m²
1-23-45-67-89-10
Reliability 6/10
Median price on the 22 transactions of the last 36 months.
from 646 to
2 032  /m²
60% of transactions from the 2nd to the 8th deciles.
HousesEvolution of the price per m² of houses since...
1 year
--
2 years
--
3 years
--
4 years
--
5 years
--
6 years
--
7 years
--
8 years
--
9 years
--
10 years
--
11 years
--
ApartmentsEvolution of the price per m² of apartments since...
1 year
--
2 years
--
3 years
--
4 years
--
5 years
--
6 years
--
7 years
--
8 years
--
9 years
--
10 years
--
11 years
--

Yearly evolution

Evolution of the median price per m²

Evolution of the number of transactions

Warning, last year incomplete. Projections made based on the proportions between semesters of the previous year at the departmental/national level and by type of property.

Yearly data

Descending order
Year
Houses
house
transactions
Houses
house
Price per m²
Apartments
apt.
transactions
Apartments
apt.
Price per m²
2025
2
2 341 
0
--- 
2024
5
1 083 
0
--- 
2023
7
1 920 
3
469 
2022
7
1 131 
0
--- 
2021
11
1 391 
0
--- 
2020
17
1 085 
0
--- 
2019
8
914 
0
--- 
2018
12
1 395 
0
--- 
2017
4
1 728 
0
--- 
2016
12
1 132 
0
--- 
2015
6
1 369 
0
--- 
2014
7
1 024 
0
--- 

Analysis

Structure of prices per m²

Values of price percentiles per m² over the periods used for the estimated price of each type of property.

Structure of transaction amounts

Values of transaction amounts percentiles over the periods used for the estimated price of each type of property.

Transaction amounts and prices per m² by percentile

Ascending order
Percentile
Houses
house
Price per m²
Houses
house
Transaction amount
Apartments
apt.
Price per m²
Apartments
apt.
Transaction amount
10th percentile
668 
42 404 
358 
35 667 
20th percentile
769 
70 000 
386 
35 667 
30th percentile
890 
78 960 
413 
35 667 
40th percentile
1 093 
93 600 
441 
35 667 
50th percentile
1 221 
100 K
469 
35 667 
60th percentile
1 511 
108 K
494 
35 667 
70th percentile
1 852 
132 K
519 
35 667 
80th percentile
2 078 
201 K
544 
35 667 
90th percentile
2 553 
276 K
569 
35 667 

National and departmental comparison

Evolution of the median price per m² of houses

Evolution of the median price per m² of apartments

Quarterly evolution

Evolution of the median price per m²

Evolution of the number of transactions

Quarterly data

Descending order
Quarter
Houses
house
transactions
Houses
house
Price per m²
Apartments
apt.
transactions
Apartments
apt.
Price per m²
2025 Q2
1
3 692 
0
--- 
2025 Q1
1
990 
0
--- 
2024 Q4
1
2 268 
0
--- 
2024 Q3
1
132 
0
--- 
2024 Q2
1
1 221 
0
--- 
2024 Q1
2
954 
0
--- 
2023 Q4
4
1 905 
0
--- 
2023 Q3
1
1 333 
0
--- 
2023 Q2
2
2 012 
3
469 
2022 Q4
2
1 344 
0
--- 
2022 Q3
3
755 
0
--- 
2022 Q1
2
2 204 
0
--- 
2021 Q4
2
1 350 
0
--- 
2021 Q3
1
1 800 
0
--- 
2021 Q2
6
1 570 
0
--- 
2021 Q1
2
1 122 
0
--- 
2020 Q4
5
686 
0
--- 
2020 Q3
8
1 128 
0
--- 
2020 Q2
3
1 228 
0
--- 
2020 Q1
1
1 595 
0
--- 
2019 Q4
1
743 
0
--- 
2019 Q3
3
721 
0
--- 
2019 Q2
2
820 
0
--- 
2019 Q1
2
1 368 
0
--- 
2018 Q4
3
1 400 
0
--- 
2018 Q3
4
1 475 
0
--- 
2018 Q2
4
1 444 
0
--- 
2018 Q1
1
938 
0
--- 
2017 Q4
1
1 857 
0
--- 
2017 Q3
1
1 909 
0
--- 
2017 Q2
1
667 
0
--- 
2017 Q1
1
1 600 
0
--- 
2016 Q4
3
1 000 
0
--- 
2016 Q3
3
1 136 
0
--- 
2016 Q2
4
1 405 
0
--- 
2016 Q1
2
858 
0
--- 
2015 Q3
3
1 353 
0
--- 
2015 Q2
1
1 385 
0
--- 
2015 Q1
2
1 116 
0
--- 
2014 Q4
3
589 
0
--- 
2014 Q3
2
1 420 
0
--- 
2014 Q2
2
978 
0
--- 

Aude (11)

Most expensive cities

City
name
Descending orderHouses
house
Price per m²
5 422 
4 000 
3 803 
3 420 
3 125 
2 857 
2 717 
2 645 
2 630 
2 604 
City
name
Descending orderApartments
apt.
Price per m²
3 729 
3 398 
3 315 
3 054 
2 950 
2 545 
2 544 
2 302 
2 252 
2 078 

Least expensive cities

City
name
Ascending orderHouses
house
Price per m²
524 
563 
576 
588 
597 
600 
City
name
Ascending orderApartments
apt.
Price per m²
113 
161 
169 
264 
275 
279 
287