emooki
HomePrice mapTransactions
🇬🇧 English🇫🇷 Français🇩🇪 Deutsch🇪🇸 Español🇮🇹 Italiano

Real estate price map


Real estate price map in the municipality of Coursan, choose a section to see transactions by parcel.

Aude (11)

Coursan - Real estate price m²

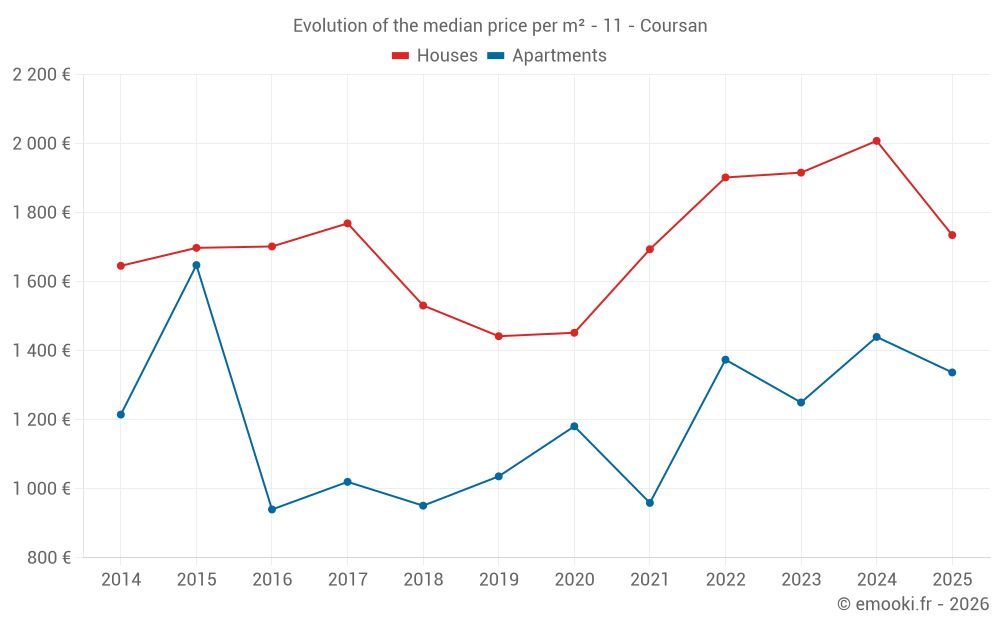
Median price of real estate
in the municipality of Coursan

HousesHouses
1 735  /m²
1-23-45-67-89-10
Reliability 9/10
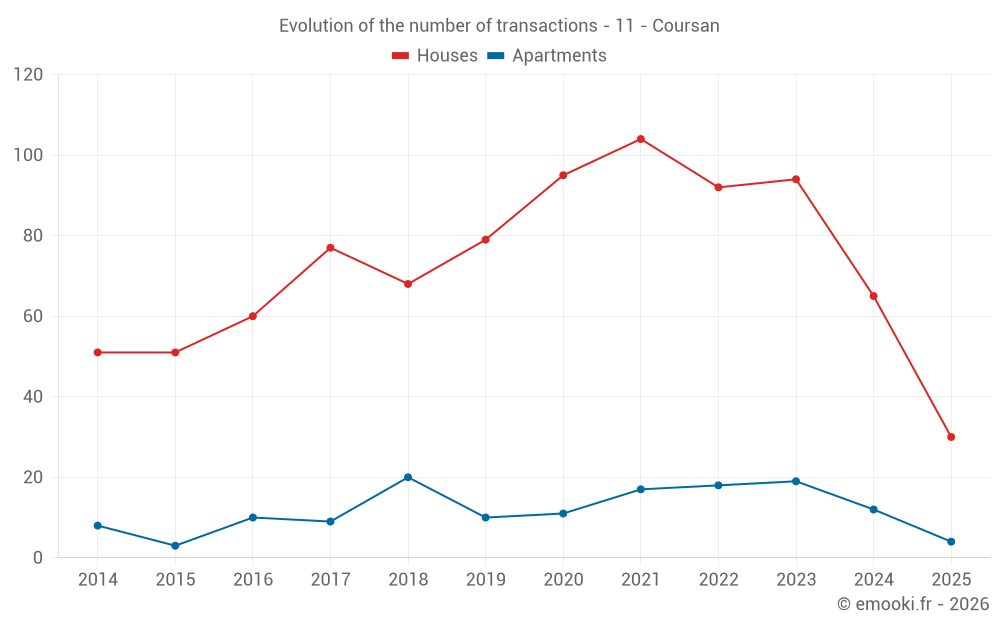
Median price on the 30 transactions of the last 6 months.
from 1 004 to
2 481  /m²
60% of transactions from the 2nd to the 8th deciles.
ApartmentsApartments
1 412  /m²
1-23-45-67-89-10
Reliability 7/10
Median price on the 22 transactions of the last 24 months.
from 1 142 to
1 750  /m²
60% of transactions from the 2nd to the 8th deciles.
DwellingsDwellings
1 562  /m²
1-23-45-67-89-10
Reliability 9/10
Median price on the 34 transactions of the last 6 months.
from 1 076 to
2 465  /m²
60% of transactions from the 2nd to the 8th deciles.
HousesEvolution of the price per m² of houses since...
1 year
-14%
2 years
-9.4%
3 years
-8.8%
4 years
+2.4%
5 years
+19%
6 years
+20%
7 years
+13%
8 years
-1.9%
9 years
+1.9%
10 years
+2.2%
11 years
+5.4%
The price per m² of houses has decreased by 14% since 1 year, but it has increased by 20% in 6 years.
ApartmentsEvolution of the price per m² of apartments since...
1 year
-7.2%
2 years
+7%
3 years
-2.7%
4 years
+39%
5 years
+13%
6 years
+29%
7 years
+41%
8 years
+31%
9 years
+42%
10 years
--
11 years
+10%
The price per m² of apartments has decreased by 7.2% since 1 year, but it has increased by 42% in 9 years.

Yearly evolution

Evolution of the median price per m²

Evolution of the median price per m² - 11 - Coursan

Evolution of the number of transactions

Warning, last year incomplete. Projections made based on the proportions between semesters of the previous year at the departmental/national level and by type of property.

Evolution of the number of transactions - 11 - Coursan

Yearly data

Descending order
Year
Houses
house
transactions
Houses
house
Price per m²
Apartments
apt.
transactions
Apartments
apt.
Price per m²
2025
30
1 735 
4
1 337 
2024
65
2 008 
12
1 440 
2023
94
1 916 
19
1 250 
2022
92
1 902 
18
1 374 
2021
104
1 694 
17
959 
2020
95
1 452 
11
1 181 
2019
79
1 442 
10
1 036 
2018
68
1 531 
20
951 
2017
77
1 769 
9
1 020 
2016
60
1 702 
10
940 
2015
51
1 698 
3
1 648 
2014
51
1 646 
8
1 215 

Analysis

Structure of prices per m²

Values of price percentiles per m² over the periods used for the estimated price of each type of property.

Structure of transaction amounts

Values of transaction amounts percentiles over the periods used for the estimated price of each type of property.

Transaction amounts and prices per m² by percentile

Ascending order
Percentile
Houses
house
Price per m²
Houses
house
Transaction amount
Apartments
apt.
Price per m²
Apartments
apt.
Transaction amount
10th percentile
809 
68 423 
1 060 
48 100 
20th percentile
1 004 
86 200 
1 142 
52 760 
30th percentile
1 200 
118 K
1 179 
67 625 
40th percentile
1 430 
142 K
1 309 
84 840 
50th percentile
1 735 
166 K
1 412 
97 755 
60th percentile
2 041 
188 K
1 499 
106 K
70th percentile
2 342 
212 K
1 708 
135 K
80th percentile
2 481 
260 K
1 750 
164 K
90th percentile
2 697 
292 K
1 899 
188 K

National and departmental comparison

Evolution of the median price per m² of houses

Evolution of the median price per m² of apartments

Quarterly evolution

Evolution of the median price per m²

Evolution of the number of transactions

Quarterly data

Descending order
Quarter
Houses
house
transactions
Houses
house
Price per m²
Apartments
apt.
transactions
Apartments
apt.
Price per m²
2025 Q2
16
1 945 
2
1 216 
2025 Q1
14
1 476 
2
1 704 
2024 Q4
12
2 002 
5
1 532 
2024 Q3
15
2 056 
5
1 171 
2024 Q2
17
2 111 
1
2 302 
2024 Q1
21
2 022 
1
394 
2023 Q4
25
1 867 
2
1 387 
2023 Q3
25
1 948 
4
1 526 
2023 Q2
23
1 989 
6
1 076 
2023 Q1
21
2 043 
7
1 587 
2022 Q4
19
1 641 
2
1 336 
2022 Q3
28
1 940 
5
2 085 
2022 Q2
25
1 690 
6
1 168 
2022 Q1
20
2 088 
5
1 381 
2021 Q4
33
1 663 
1
955 
2021 Q3
23
1 842 
5
1 190 
2021 Q2
27
1 726 
6
952 
2021 Q1
21
1 564 
5
923 
2020 Q4
38
1 316 
7
1 061 
2020 Q3
18
1 900 
1
294 
2020 Q2
20
1 284 
2
1 316 
2020 Q1
19
1 558 
1
1 181 
2019 Q4
21
1 282 
1
964 
2019 Q3
25
1 778 
3
1 071 
2019 Q2
26
1 614 
0
--- 
2019 Q1
7
1 621 
6
1 064 
2018 Q4
16
1 606 
3
959 
2018 Q3
21
1 529 
7
1 065 
2018 Q2
17
1 508 
4
884 
2018 Q1
14
1 636 
6
790 
2017 Q4
14
1 992 
5
1 020 
2017 Q3
20
1 796 
4
1 178 
2017 Q2
27
1 761 
0
--- 
2017 Q1
16
1 510 
0
--- 
2016 Q4
13
1 938 
3
1 243 
2016 Q3
18
1 462 
4
1 132 
2016 Q2
19
1 738 
2
542 
2016 Q1
10
2 006 
1
571 
2015 Q4
18
1 544 
0
--- 
2015 Q3
11
1 813 
2
1 454 
2015 Q2
14
1 547 
0
--- 
2015 Q1
8
1 884 
1
1 704 
2014 Q4
15
1 688 
2
864 
2014 Q3
11
1 881 
3
1 654 
2014 Q2
15
1 214 
0
--- 
2014 Q1
10
1 827 
3
1 180 

Overview of the latest real estate transactions

The following list is an anonymized overview of the latest transactions. For more details and to find all transactions, please use the map to view transactions by plot or the transaction search page for a search by criteria.

2025-06-20
90 000 
1 011  /m²(89 m²)
Sale
Houses
House
2 rooms
89 m2
Land
422 m2
-Sols
Land
196 m2
-Landes
Land
350 m2
-Sols
2025-06-11
290 150 
2 073  /m²(140 m²)
Sale
Houses
House
7 rooms
140 m2
Land
540 m2
-Sols
2025-06-04
216 000 
Sale
Land
1500 m2
-Terrains à bâtir
Land
1500 m2
-Terrains à bâtir
2025-05-30
71 000 
816  /m²(87 m²)
Sale
Houses
House
5 rooms
87 m2
Land
25 m2
-Sols
2025-05-27
32 000 
Sale
Land
4047 m2
-Vignes
Land
1519 m2
-Vignes
Land
1773 m2
-Vignes
Land
4991 m2
-Vignes
Land
3300 m2
-Vignes
Land
3427 m2
-Vignes
Land
2012 m2
-Vignes
2025-05-20
185 000 
1 869  /m²(99 m²)
Sale
Houses
House
6 rooms
99 m2
Land
406 m2
-Sols
2025-05-16
68 470 
978  /m²(70 m²)
Sale
Houses
House
3 rooms
70 m2
Land
41 m2
-Sols
2025-05-14
261 235 
2 441  /m²(107 m²)
Sale
Houses
House
5 rooms
107 m2
Land
470 m2
-Sols
2025-04-30
321 850 
2 728  /m²(118 m²)
Sale
Houses
House
4 rooms
118 m2
1 outbuilding
Land
1804 m2
-Sols
2025-04-30
22 000 
333  /m²(66 m²)
Sale
Houses
House
3 rooms
66 m2
Land
33 m2
-Sols
2025-04-30
73 750 
1 152  /m²(64 m²)
Sale
Apartments
Apartment
3 rooms
64 m2
2 outbuildings
2025-04-29
192 000 
2 021  /m²(95 m²)
Sale
Houses
House
4 rooms
95 m2
Land
430 m2
-Sols
2025-04-29
75 000 
Sale
1 outbuilding
Land
118 m2
-Sols
2025-04-28
228 000 
2 850  /m²(80 m²)
Sale
Houses
House
4 rooms
80 m2
Land
126 m2
-Sols
2025-04-25
261 300 
2 694  /m²(97 m²)
Sale
Houses
House
5 rooms
97 m2
1 outbuilding
Land
407 m2
-Sols
2025-04-22
202 400 
2 300  /m²(88 m²)
Sale
Houses
House
5 rooms
88 m2
Land
184 m2
-Sols
2025-04-18
145 200 
1 613  /m²(90 m²)
Sale
Houses
House
5 rooms
90 m2
Land
145 m2
-Sols
2025-04-17
27 500 
Sale
Land
17953 m2
-Vignes
2025-04-16
230 200 
2 172  /m²(106 m²)
2 475  /m²(93 m²)
Sale
Houses
House
4 rooms
93 m2
Commercial property
13 m2
Land
324 m2
-Sols
2025-04-16
312 000 
2 476  /m²(126 m²)
Sale
Houses
House
4 rooms
126 m2
Land
510 m2
-Sols
1586 transactions listed in the municipality

Aude (11)

Most expensive cities

City
name
Descending orderHouses
house
Price per m²
5 422 
4 000 
3 803 
3 420 
3 125 
2 857 
2 717 
2 645 
2 630 
2 604 
City
name
Descending orderApartments
apt.
Price per m²
3 729 
3 398 
3 315 
3 054 
2 950 
2 545 
2 544 
2 302 
2 252 
2 078 

Least expensive cities

City
name
Ascending orderHouses
house
Price per m²
524 
563 
576 
588 
597 
600 
City
name
Ascending orderApartments
apt.
Price per m²
113 
161 
169 
264 
275 
279 
287