Median price of real estate
in the municipality of Hargnies
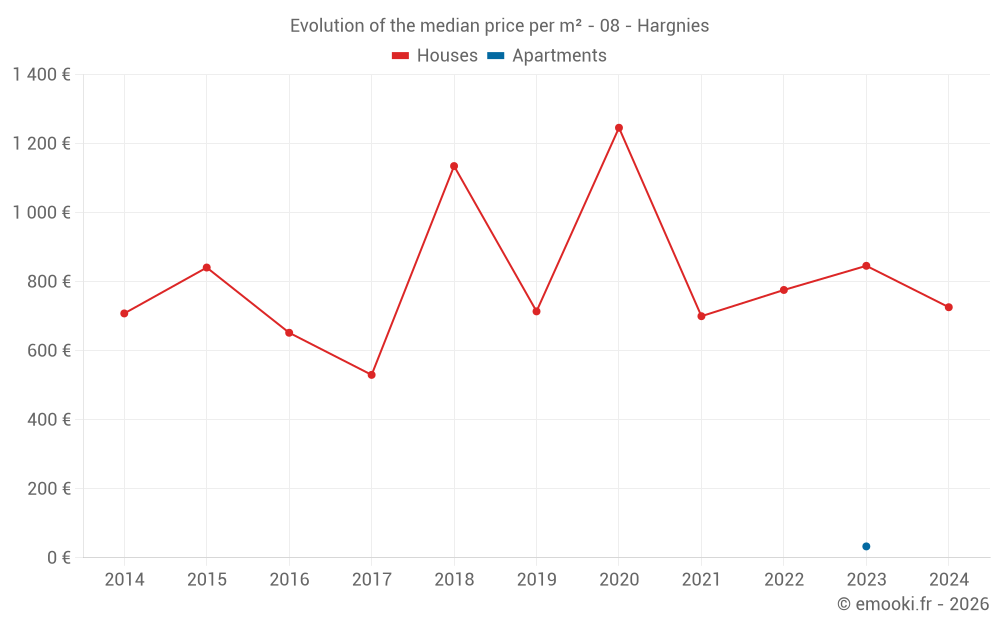
Houses
838 € /m²
Reliability 6/10
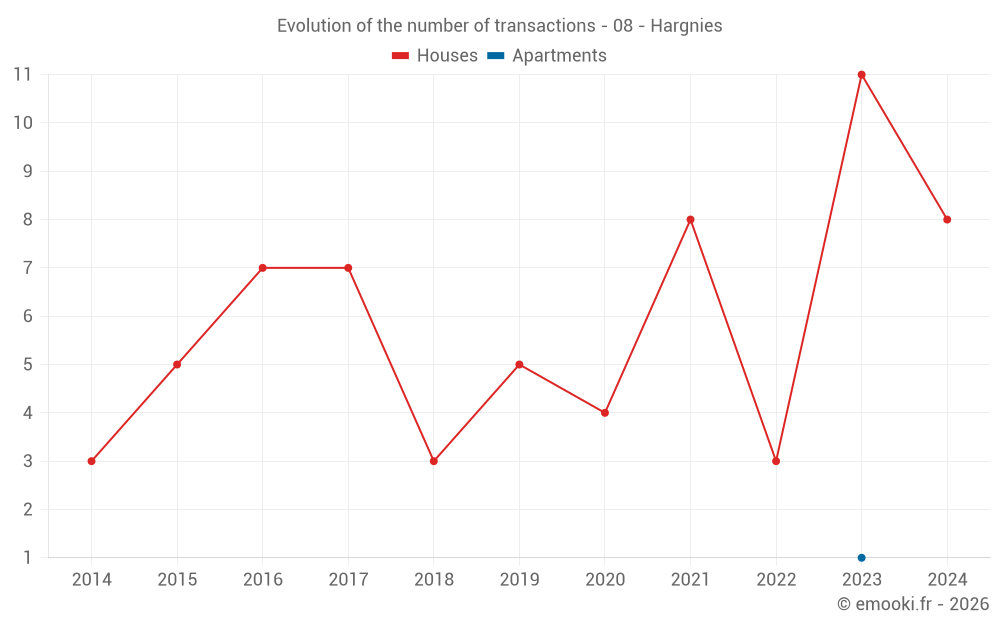
Median price on the 20 transactions of the last 36 months.
from 541 to
1 243 € /m²
1 243 € /m²
60% of transactions from the 2nd to the 8th deciles.
Apartments
33 € /m²
Reliability 1/10
Price of the unique transaction of the last 120 months.
Dwellings
830 € /m²
Reliability 6/10
Median price on the 21 transactions of the last 36 months.
from 423 to
1 236 € /m²
1 236 € /m²
60% of transactions from the 2nd to the 8th deciles.