emooki
HomePrice mapTransactions
🇬🇧 English🇫🇷 Français🇩🇪 Deutsch🇪🇸 Español🇮🇹 Italiano

Real estate price map


Real estate price map in the municipality of Moulins.

Allier (03)
Moulins

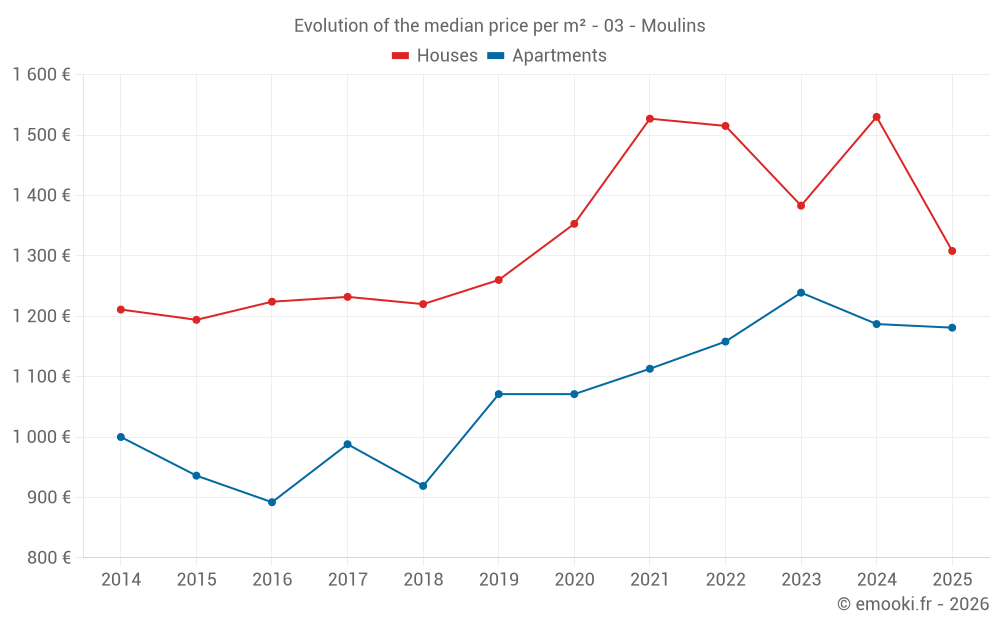
Median price of real estate
in the municipality of Moulins

HousesHouses
1 400 € /m²
1-23-45-67-89-10
Reliability 10/10
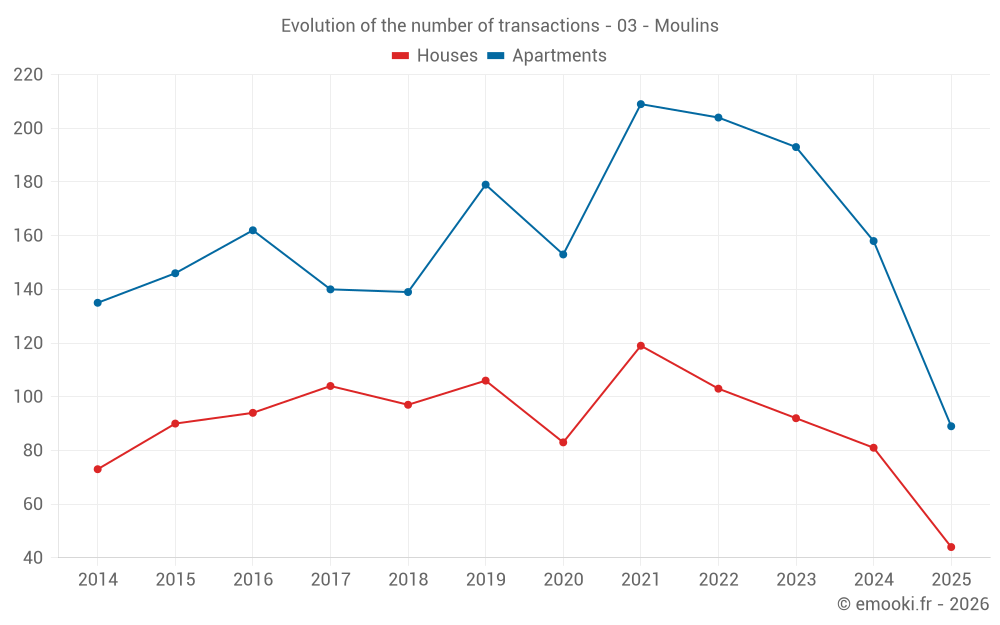
Median price on the 20 transactions of the last 3 months.
from 1 047 to
2 129 € /m²
60% of transactions from the 2nd to the 8th deciles.
ApartmentsApartments
1 094 € /m²
1-23-45-67-89-10
Reliability 10/10
Median price on the 46 transactions of the last 3 months.
from 800 to
1 527 € /m²
60% of transactions from the 2nd to the 8th deciles.
DwellingsDwellings
1 192 € /m²
1-23-45-67-89-10
Reliability 10/10
Median price on the 66 transactions of the last 3 months.
from 825 to
1 650 € /m²
60% of transactions from the 2nd to the 8th deciles.
HousesEvolution of the price per m² of houses since...
1 year
-15%
2 years
-5.4%
3 years
-14%
4 years
-14%
5 years
-3.3%
6 years
+3.8%
7 years
+7.2%
8 years
+6.2%
9 years
+6.9%
10 years
+10%
11 years
+8%
ApartmentsEvolution of the price per m² of apartments since...
1 year
-0.5%
2 years
-4.7%
3 years
+2%
4 years
+6.1%
5 years
+10%
6 years
+10%
7 years
+29%
8 years
+20%
9 years
+32%
10 years
+26%
11 years
+18%

Yearly evolution

Evolution of the median price per m²

Evolution of the number of transactions

Warning, last year incomplete. Projections made based on the proportions between semesters of the previous year at the departmental/national level and by type of property.

Yearly data

Descending order
Year
Houses
house
transactions
Houses
house
Price per m²
Apartments
apt.
transactions
Apartments
apt.
Price per m²
2025
44
1 308 €
89
1 181 €
2024
81
1 530 €
158
1 187 €
2023
92
1 383 €
193
1 239 €
2022
103
1 515 €
204
1 158 €
2021
119
1 527 €
209
1 113 €
2020
83
1 353 €
153
1 071 €
2019
106
1 260 €
179
1 071 €
2018
97
1 220 €
139
919 €
2017
104
1 232 €
140
988 €
2016
94
1 224 €
162
892 €
2015
90
1 194 €
146
936 €
2014
73
1 211 €
135
1 000 €

Analysis

Structure of prices per m²

Values of price percentiles per m² over the periods used for the estimated price of each type of property.

Structure of transaction amounts

Values of transaction amounts percentiles over the periods used for the estimated price of each type of property.

Transaction amounts and prices per m² by percentile

Ascending order
Percentile
Houses
house
Price per m²
Houses
house
Transaction amount
Apartments
apt.
Price per m²
Apartments
apt.
Transaction amount
10th percentile
735 €
54 700 €
714 €
39 000 €
20th percentile
1 047 €
87 600 €
800 €
56 200 €
30th percentile
1 155 €
93 252 €
890 €
61 500 €
40th percentile
1 263 €
107 K€
1 027 €
77 000 €
50th percentile
1 400 €
125 K€
1 094 €
88 000 €
60th percentile
1 712 €
142 K€
1 216 €
100 K€
70th percentile
1 833 €
152 K€
1 428 €
121 K€
80th percentile
2 129 €
165 K€
1 527 €
154 K€
90th percentile
2 194 €
181 K€
1 665 €
183 K€

National and departmental comparison

Evolution of the median price per m² of houses

Evolution of the median price per m² of apartments

Quarterly evolution

Evolution of the median price per m²

Evolution of the number of transactions

Quarterly data

Descending order
Quarter
Houses
house
transactions
Houses
house
Price per m²
Apartments
apt.
transactions
Apartments
apt.
Price per m²
2025 Q2
20
1 400 €
46
1 094 €
2025 Q1
24
1 297 €
43
1 193 €
2024 Q4
21
1 530 €
39
1 340 €
2024 Q3
26
1 318 €
31
1 161 €
2024 Q2
12
1 708 €
55
1 212 €
2024 Q1
22
1 519 €
33
1 100 €
2023 Q4
22
1 326 €
53
1 167 €
2023 Q3
26
1 658 €
43
1 364 €
2023 Q2
23
1 613 €
41
1 279 €
2023 Q1
21
1 095 €
56
1 196 €
2022 Q4
24
1 570 €
58
1 057 €
2022 Q3
26
1 712 €
46
1 104 €
2022 Q2
28
1 292 €
57
1 204 €
2022 Q1
25
1 515 €
43
1 170 €
2021 Q4
32
1 602 €
51
1 035 €
2021 Q3
25
1 527 €
49
1 159 €
2021 Q2
34
1 497 €
58
1 135 €
2021 Q1
28
1 532 €
51
1 085 €
2020 Q4
34
1 361 €
44
1 067 €
2020 Q3
15
1 437 €
41
1 098 €
2020 Q2
16
1 312 €
34
1 026 €
2020 Q1
18
1 140 €
34
1 079 €
2019 Q4
29
1 200 €
49
1 304 €
2019 Q3
24
1 348 €
41
1 063 €
2019 Q2
24
1 244 €
43
941 €
2019 Q1
29
1 250 €
46
1 085 €
2018 Q4
30
1 016 €
45
917 €
2018 Q3
29
1 351 €
31
966 €
2018 Q2
18
1 142 €
43
938 €
2018 Q1
20
1 184 €
20
902 €
2017 Q4
29
1 249 €
32
975 €
2017 Q3
30
1 114 €
36
1 074 €
2017 Q2
22
1 399 €
37
931 €
2017 Q1
23
1 217 €
35
920 €
2016 Q4
27
1 231 €
31
833 €
2016 Q3
22
1 320 €
48
890 €
2016 Q2
24
1 057 €
43
933 €
2016 Q1
21
1 053 €
40
929 €
2015 Q4
27
1 128 €
44
944 €
2015 Q3
26
1 202 €
35
956 €
2015 Q2
24
1 341 €
39
902 €
2015 Q1
13
1 346 €
28
898 €
2014 Q4
21
1 352 €
31
1 063 €
2014 Q3
19
1 190 €
24
1 138 €
2014 Q2
22
1 111 €
46
921 €
2014 Q1
11
1 251 €
34
1 000 €

Allier (03)

Most expensive cities

City
name
Descending orderHouses
house
Price per m²
2 114 €
1 949 €
1 934 €
1 924 €
1 909 €
1 854 €
1 842 €
1 814 €
1 814 €
1 806 €
City
name
Descending orderApartments
apt.
Price per m²
7 500 €
2 014 €
1 795 €
1 750 €
1 749 €
1 638 €
1 463 €
1 457 €
1 414 €
1 395 €

Least expensive cities

City
name
Ascending orderHouses
house
Price per m²
287 €
303 €
348 €
366 €
413 €
483 €
492 €
506 €
City
name
Ascending orderApartments
apt.
Price per m²
86 €
111 €
138 €
158 €
158 €
160 €
167 €
172 €