emooki
HomePrice mapTransactions
🇬🇧 English🇫🇷 Français🇩🇪 Deutsch🇪🇸 Español🇮🇹 Italiano

Real estate price map


Real estate price map in the municipality of Châtel-de-Neuvre.

Allier (03)
Châtel-de-Neuvre

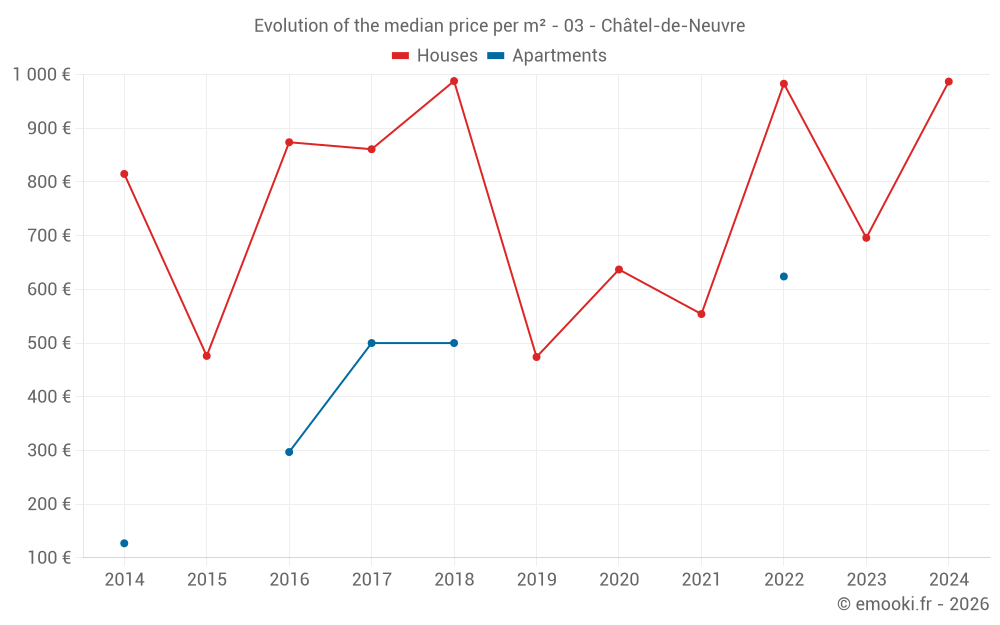
Median price of real estate
in the municipality of Châtel-de-Neuvre

HousesHouses
936  /m²
1-23-45-67-89-10
Reliability 6/10
Median price on the 18 transactions of the last 36 months.
from 606 to
1 208  /m²
60% of transactions from the 2nd to the 8th deciles.
ApartmentsApartments
500  /m²
1-23-45-67-89-10
Reliability 1/10
Median price on the 4 transactions of the last 120 months.
DwellingsDwellings
936  /m²
1-23-45-67-89-10
Reliability 6/10
Median price on the 18 transactions of the last 36 months.
from 606 to
1 208  /m²
60% of transactions from the 2nd to the 8th deciles.
HousesEvolution of the price per m² of houses since...
1 year
--
2 years
--
3 years
--
4 years
--
5 years
--
6 years
--
7 years
--
8 years
--
9 years
--
10 years
--
11 years
--
ApartmentsEvolution of the price per m² of apartments since...
1 year
--
2 years
--
3 years
--
4 years
--
5 years
--
6 years
--
7 years
--
8 years
--
9 years
--
10 years
--
11 years
--

Yearly evolution

Evolution of the median price per m²

Evolution of the number of transactions

Warning, last year incomplete.

Yearly data

Descending order
Year
Houses
house
transactions
Houses
house
Price per m²
Apartments
apt.
transactions
Apartments
apt.
Price per m²
2025
0
--- 
0
--- 
2024
3
987 
0
--- 
2023
10
696 
0
--- 
2022
11
983 
1
624 
2021
4
554 
0
--- 
2020
8
637 
0
--- 
2019
6
474 
0
--- 
2018
12
988 
1
500 
2017
4
861 
1
500 
2016
2
874 
1
297 
2015
2
476 
0
--- 
2014
5
815 
1
127 

Analysis

Structure of prices per m²

Values of price percentiles per m² over the periods used for the estimated price of each type of property.

Structure of transaction amounts

Values of transaction amounts percentiles over the periods used for the estimated price of each type of property.

Transaction amounts and prices per m² by percentile

Ascending order
Percentile
Houses
house
Price per m²
Houses
house
Transaction amount
Apartments
apt.
Price per m²
Apartments
apt.
Transaction amount
10th percentile
259 
16 900 
358 
25 150 
20th percentile
606 
55 400 
419 
28 300 
30th percentile
646 
63 900 
480 
31 450 
40th percentile
731 
79 300 
500 
37 000 
50th percentile
936 
80 000 
500 
43 750 
60th percentile
992 
87 600 
500 
50 500 
70th percentile
1 130 
104 K
512 
55 800 
80th percentile
1 208 
110 K
550 
58 200 
90th percentile
1 539 
160 K
587 
60 600 

National and departmental comparison

Evolution of the median price per m² of houses

Evolution of the median price per m² of apartments

Quarterly evolution

Evolution of the median price per m²

Evolution of the number of transactions

Quarterly data

Descending order
Quarter
Houses
house
transactions
Houses
house
Price per m²
Apartments
apt.
transactions
Apartments
apt.
Price per m²
2024 Q3
2
1 077 
0
--- 
2024 Q2
1
638 
0
--- 
2023 Q4
3
748 
0
--- 
2023 Q3
2
1 325 
0
--- 
2023 Q2
4
223 
0
--- 
2023 Q1
1
584 
0
--- 
2022 Q4
1
889 
0
--- 
2022 Q3
4
1 110 
0
--- 
2022 Q2
1
797 
1
624 
2022 Q1
5
1 044 
0
--- 
2021 Q3
2
306 
0
--- 
2021 Q2
1
1 042 
0
--- 
2021 Q1
1
708 
0
--- 
2020 Q4
3
507 
0
--- 
2020 Q3
1
1 571 
0
--- 
2020 Q2
1
514 
0
--- 
2020 Q1
3
787 
0
--- 
2019 Q4
1
1 289 
0
--- 
2019 Q3
4
446 
0
--- 
2019 Q1
1
491 
0
--- 
2018 Q4
2
782 
0
--- 
2018 Q3
2
1 306 
0
--- 
2018 Q2
5
977 
1
500 
2018 Q1
3
947 
0
--- 
2017 Q4
1
600 
0
--- 
2017 Q3
2
975 
1
500 
2017 Q2
1
772 
0
--- 
2016 Q4
1
633 
0
--- 
2016 Q3
1
1 114 
0
--- 
2016 Q1
0
--- 
1
297 
2015 Q4
2
476 
0
--- 
2014 Q4
4
1 181 
0
--- 
2014 Q3
1
815 
1
127 

Allier (03)

Most expensive cities

City
name
Descending orderHouses
house
Price per m²
1 949 
1 924 
1 909 
1 854 
1 842 
1 814 
1 806 
City
name
Descending orderApartments
apt.
Price per m²
1 750 
1 749 
1 638 
1 463 
1 457 
1 414 
1 395 

Least expensive cities

City
name
Ascending orderHouses
house
Price per m²
303 
348 
366 
413 
483 
492 
City
name
Ascending orderApartments
apt.
Price per m²
86 
138 
158 
160 
172