Real estate price map
Real estate price map in the municipality of Buxières-les-Mines, choose a section to see transactions by parcel.
Allier (03)
Price per m² in Buxières-les-Mines
Median price of real estate
in the municipality of Buxières-les-Mines
Houses
667 € /m²
Reliability 7/10
Median price on the 32 transactions of the last 24 months.
from 449 to
1 224 € /m²
1 224 € /m²
60% of transactions from the 2nd to the 8th deciles.
Apartments
306 € /m²
Reliability 2/10
Median price on the 4 transactions of the last 96 months.
Dwellings
659 € /m²
Reliability 7/10
Median price on the 34 transactions of the last 24 months.
from 455 to
1 171 € /m²
1 171 € /m²
60% of transactions from the 2nd to the 8th deciles.
Evolution of the price per m² of houses since...
1 year
-23%
2 years
-33%
3 years
-21%
4 years
-21%
5 years
-5%
6 years
-19%
7 years
-30%
8 years
-30%
9 years
-25%
10 years
-31%
11 years
-49%
320 transactions listed in the municipality
Yearly data
Yearly evolution of the median price per m²

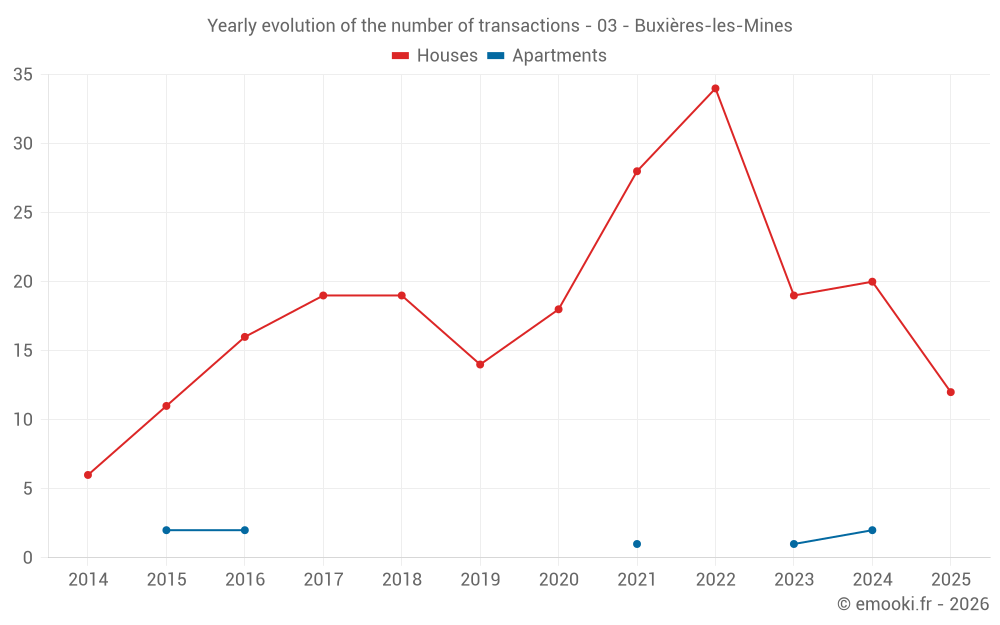
Yearly evolution of the number of transactions
Yearly table
Year
house
transactions
transactions
house
Price per m²
Price per m²
apt.
transactions
transactions
apt.
Price per m²
Price per m²
2025
12
571 €
0
--- €
2024
20
739 €
2
562 €
2023
19
851 €
1
147 €
2022
34
720 €
0
--- €
2021
28
722 €
1
83 €
2020
18
601 €
0
--- €
2019
14
708 €
0
--- €
2018
19
820 €
0
--- €
2017
19
814 €
0
--- €
2016
16
762 €
2
216 €
2015
11
827 €
2
198 €
2014
6
1 120 €
0
--- €
Analysis
Structure of prices per m²
Values of price percentiles per m² over the periods used for the estimated price of each type of property.
Structure of transaction amounts
Values of transaction amounts percentiles over the periods used for the estimated price of each type of property.
Transaction amounts and prices per m² by percentile
Percentile
house
Price per m²
Price per m²
house
Transaction amount
Transaction amount
apt.
Price per m²
Price per m²
apt.
Transaction amount
Transaction amount
10th percentile
338 €
30 950 €
102 €
16 200 €
20th percentile
449 €
37 050 €
121 €
17 400 €
30th percentile
542 €
42 750 €
141 €
18 600 €
40th percentile
610 €
50 180 €
210 €
21 140 €
50th percentile
667 €
55 050 €
306 €
24 350 €
60th percentile
759 €
60 360 €
401 €
27 560 €
70th percentile
870 €
67 245 €
484 €
30 830 €
80th percentile
1 224 €
72 800 €
543 €
34 220 €
90th percentile
1 361 €
84 605 €
602 €
37 610 €
National and departmental comparison
Evolution of the median price per m² of houses
Evolution of the median price per m² of apartments
Quarterly data
Quarterly evolution of the median price per m²
Quarterly evolution of the number of transactions
Quarterly table
Quarter
house
transactions
transactions
house
Price per m²
Price per m²
apt.
transactions
transactions
apt.
Price per m²
Price per m²
2025 Q4
3
746 €
0
--- €
2025 Q3
2
560 €
0
--- €
2025 Q2
4
395 €
0
--- €
2025 Q1
3
677 €
0
--- €
2024 Q4
5
864 €
0
--- €
2024 Q3
5
577 €
1
661 €
2024 Q2
5
767 €
1
464 €
2024 Q1
5
657 €
0
--- €
2023 Q4
3
1 202 €
0
--- €
2023 Q3
2
988 €
0
--- €
2023 Q2
10
554 €
0
--- €
2023 Q1
4
940 €
1
147 €
2022 Q4
11
729 €
0
--- €
2022 Q3
12
690 €
0
--- €
2022 Q2
8
871 €
0
--- €
2022 Q1
3
556 €
0
--- €
2021 Q4
10
620 €
1
83 €
2021 Q3
8
913 €
0
--- €
2021 Q2
4
875 €
0
--- €
2021 Q1
6
735 €
0
--- €
2020 Q4
3
542 €
0
--- €
2020 Q3
6
630 €
0
--- €
2020 Q2
6
640 €
0
--- €
2020 Q1
3
570 €
0
--- €
2019 Q4
3
964 €
0
--- €
2019 Q3
4
757 €
0
--- €
2019 Q2
4
665 €
0
--- €
2019 Q1
3
588 €
0
--- €
2018 Q4
2
822 €
0
--- €
2018 Q3
3
1 216 €
0
--- €
2018 Q2
8
766 €
0
--- €
2018 Q1
6
772 €
0
--- €
2017 Q4
5
768 €
0
--- €
2017 Q3
4
899 €
0
--- €
2017 Q2
5
833 €
0
--- €
2017 Q1
5
600 €
0
--- €
2016 Q4
6
1 345 €
0
--- €
2016 Q3
4
596 €
2
216 €
2016 Q2
4
268 €
0
--- €
2016 Q1
2
452 €
0
--- €
2015 Q4
3
713 €
2
198 €
2015 Q3
1
766 €
0
--- €
2015 Q2
6
858 €
0
--- €
2015 Q1
1
1 070 €
0
--- €
2014 Q4
3
1 310 €
0
--- €
2014 Q3
1
981 €
0
--- €
2014 Q2
1
944 €
0
--- €
2014 Q1
1
1 258 €
0
--- €
Key takeaways
What is the price per m2 of houses in Buxières-les-Mines?
The median price on the 32 house transactions of the last 24 months in the municipality of Buxières-les-Mines was 667 € per square meter for a median property value of 55 050 €. Over this period, 60% of transactions were between 449 and 1 224 € per square meter (from the 2nd to the 8th deciles).
Compare with neighboring municipalities
City
name
name
house
Price per m²
Price per m²
apt.
Price per m²
Price per m²
City information
Zip code
- 03440 BUXIERES LES MINES