Real estate price map
Real estate price map in the municipality of Le Nouvion-en-Thiérache, choose a section to see transactions by parcel.
Aisne (02)
Price per m² in Le Nouvion-en-Thiérache
Median price of real estate
in the municipality of Le Nouvion-en-Thiérache
Houses
778 € /m²
Reliability 9/10
Median price on the 20 transactions of the last 6 months.
from 598 to
1 347 € /m²
1 347 € /m²
60% of transactions from the 2nd to the 8th deciles.
Apartments
389 € /m²
Reliability 1/10
Median price on the 5 transactions of the last 120 months.
Dwellings
778 € /m²
Reliability 9/10
Median price on the 20 transactions of the last 6 months.
from 598 to
1 347 € /m²
1 347 € /m²
60% of transactions from the 2nd to the 8th deciles.
Evolution of the price per m² of houses since...
1 year
-1.8%
2 years
+27%
3 years
-0.7%
4 years
+24%
5 years
+42%
6 years
+50%
7 years
+35%
8 years
+4.9%
9 years
-8.4%
10 years
+53%
11 years
+65%
The price per m² of houses has decreased by 8.4% since 9 years, but it has increased by 65% in 11 years.
500 transactions listed in the municipality
Yearly data
Yearly evolution of the median price per m²

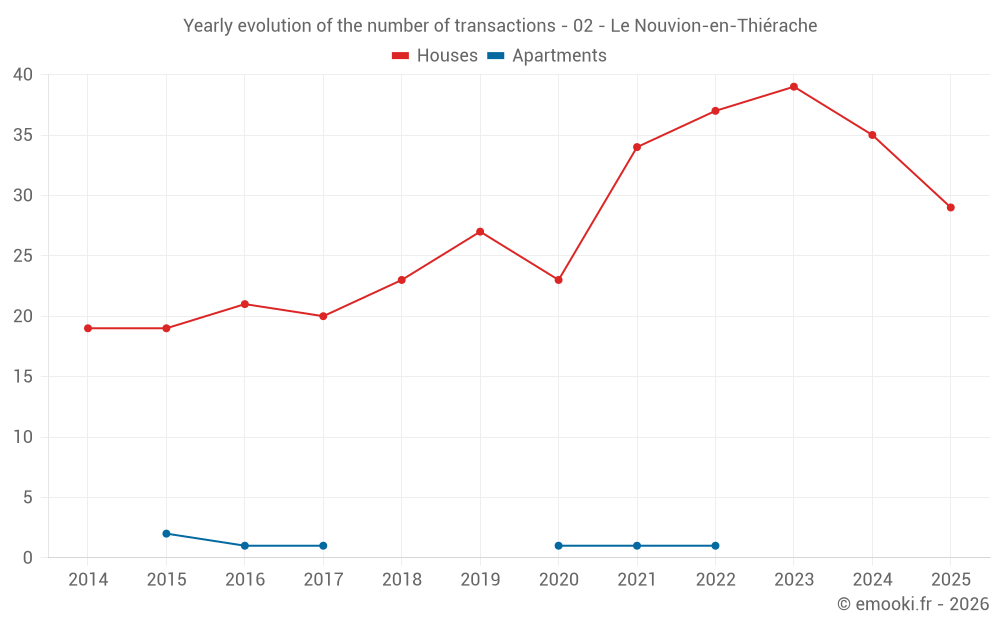
Yearly evolution of the number of transactions
Yearly table
Year
house
transactions
transactions
house
Price per m²
Price per m²
apt.
transactions
transactions
apt.
Price per m²
Price per m²
2025
29
929 €
0
--- €
2024
35
946 €
0
--- €
2023
39
732 €
0
--- €
2022
37
936 €
1
699 €
2021
34
748 €
1
956 €
2020
23
652 €
1
284 €
2019
27
620 €
0
--- €
2018
23
690 €
0
--- €
2017
20
886 €
1
389 €
2016
21
1 014 €
1
74 €
2015
19
606 €
2
382 €
2014
19
562 €
0
--- €
Analysis
Structure of prices per m²
Values of price percentiles per m² over the periods used for the estimated price of each type of property.
Structure of transaction amounts
Values of transaction amounts percentiles over the periods used for the estimated price of each type of property.
Transaction amounts and prices per m² by percentile
Percentile
house
Price per m²
Price per m²
house
Transaction amount
Transaction amount
apt.
Price per m²
Price per m²
apt.
Transaction amount
Transaction amount
10th percentile
476 €
37 200 €
158 €
32 000 €
20th percentile
598 €
43 800 €
242 €
54 000 €
30th percentile
646 €
46 050 €
305 €
72 000 €
40th percentile
741 €
65 200 €
347 €
86 000 €
50th percentile
778 €
73 500 €
389 €
100 K€
60th percentile
912 €
77 714 €
513 €
122 K€
70th percentile
1 203 €
106 K€
637 €
144 K€
80th percentile
1 347 €
136 K€
750 €
176 K€
90th percentile
1 634 €
156 K€
853 €
218 K€
National and departmental comparison
Evolution of the median price per m² of houses
Evolution of the median price per m² of apartments
Quarterly data
Quarterly evolution of the median price per m²
Quarterly evolution of the number of transactions
Quarterly table
Quarter
house
transactions
transactions
house
Price per m²
Price per m²
apt.
transactions
transactions
apt.
Price per m²
Price per m²
2025 Q4
10
766 €
0
--- €
2025 Q3
10
988 €
0
--- €
2025 Q2
6
1 019 €
0
--- €
2025 Q1
3
1 391 €
0
--- €
2024 Q4
8
810 €
0
--- €
2024 Q3
9
946 €
0
--- €
2024 Q2
8
632 €
0
--- €
2024 Q1
10
1 268 €
0
--- €
2023 Q4
11
720 €
0
--- €
2023 Q3
8
1 048 €
0
--- €
2023 Q2
12
598 €
0
--- €
2023 Q1
8
647 €
0
--- €
2022 Q4
9
789 €
1
699 €
2022 Q3
12
970 €
0
--- €
2022 Q2
9
870 €
0
--- €
2022 Q1
7
974 €
0
--- €
2021 Q4
7
638 €
0
--- €
2021 Q3
8
639 €
1
956 €
2021 Q2
9
1 069 €
0
--- €
2021 Q1
10
804 €
0
--- €
2020 Q4
3
573 €
1
284 €
2020 Q3
6
700 €
0
--- €
2020 Q2
7
565 €
0
--- €
2020 Q1
7
944 €
0
--- €
2019 Q4
5
629 €
0
--- €
2019 Q3
6
468 €
0
--- €
2019 Q2
10
690 €
0
--- €
2019 Q1
6
642 €
0
--- €
2018 Q4
10
502 €
0
--- €
2018 Q3
7
690 €
0
--- €
2018 Q2
1
1 263 €
0
--- €
2018 Q1
5
808 €
0
--- €
2017 Q4
5
875 €
0
--- €
2017 Q3
8
1 266 €
0
--- €
2017 Q2
6
710 €
0
--- €
2017 Q1
1
294 €
1
389 €
2016 Q4
3
1 348 €
0
--- €
2016 Q3
4
1 248 €
0
--- €
2016 Q2
11
828 €
1
74 €
2016 Q1
3
1 229 €
0
--- €
2015 Q4
8
619 €
0
--- €
2015 Q3
4
675 €
1
109 €
2015 Q2
4
574 €
0
--- €
2015 Q1
3
875 €
1
654 €
2014 Q4
4
630 €
0
--- €
2014 Q3
6
502 €
0
--- €
2014 Q2
5
667 €
0
--- €
2014 Q1
4
594 €
0
--- €
Key takeaways
What is the price per m2 of houses in Le Nouvion-en-Thiérache?
The median price on the 20 house transactions of the last 6 months in the municipality of Le Nouvion-en-Thiérache was 778 € per square meter for a median property value of 73 500 €. Over this period, 60% of transactions were between 598 and 1 347 € per square meter (from the 2nd to the 8th deciles).
Compare with neighboring municipalities
City
name
name
house
Price per m²
Price per m²
apt.
Price per m²
Price per m²
City information
Zip code
- 02170 LE NOUVION EN THIERACHE