Median price of real estate
in the municipality of Muscourt
Houses
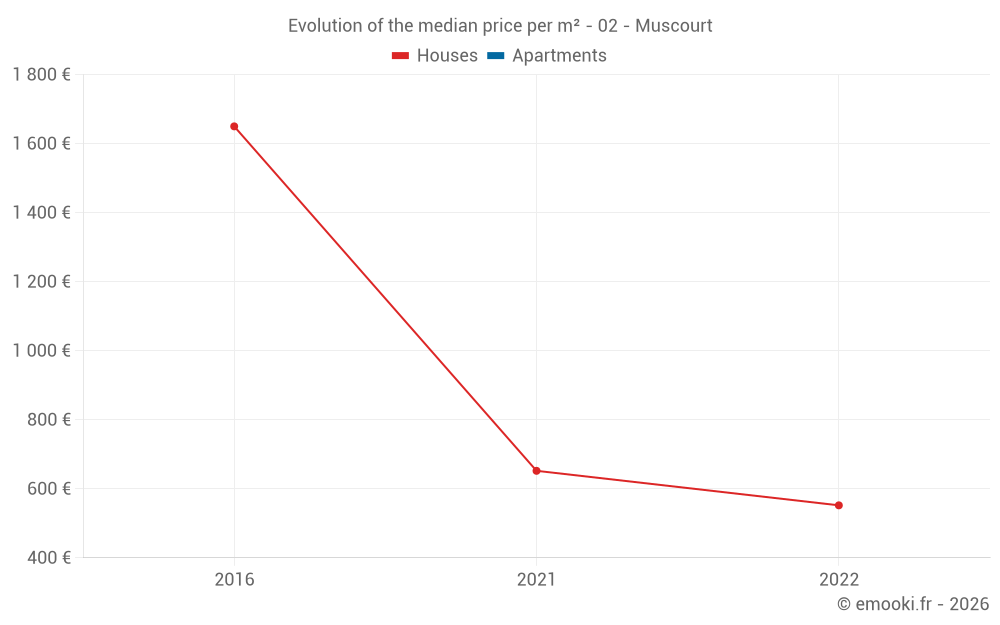
652 € /m²
Reliability 1/10
Median price on the 3 transactions of the last 120 months.
Real estate price map in the municipality of Muscourt, choose a section to see transactions by parcel.
Warning, last year incomplete. Projections made based on the proportions between semesters of the previous year at the departmental/national level and by type of property.
Values of price percentiles per m² over the periods used for the estimated price of each type of property.
Values of transaction amounts percentiles over the periods used for the estimated price of each type of property.