emooki
HomePrice mapTransactions
🇬🇧 English🇫🇷 Français🇩🇪 Deutsch🇪🇸 Español🇮🇹 Italiano

Real estate price map


Real estate price map in the municipality of Moÿ-de-l'Aisne, choose a section to see transactions by parcel.

Aisne (02)
Moÿ-de-l'Aisne

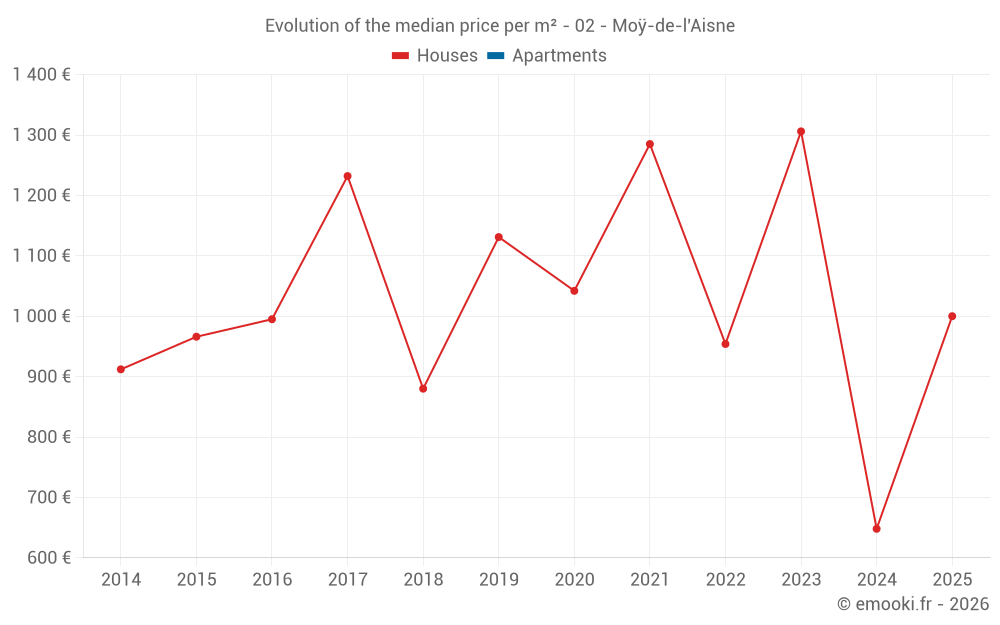
Median price of real estate
in the municipality of Moÿ-de-l'Aisne

HousesHouses
943  /m²
1-23-45-67-89-10
Reliability 7/10
Median price on the 27 transactions of the last 24 months.
from 446 to
1 513  /m²
60% of transactions from the 2nd to the 8th deciles.
HousesEvolution of the price per m² of houses since...
1 year
+54%
2 years
-23%
3 years
+4.8%
4 years
-22%
5 years
-4%
6 years
-12%
7 years
+14%
8 years
-19%
9 years
+0.5%
10 years
+3.5%
11 years
+10%
The price per m² of houses has increased by 54% since 1 year, but it has decreased by 23% in 2 years.

Yearly evolution

Evolution of the median price per m²

Evolution of the number of transactions

Warning, last year incomplete. Projections made based on the proportions between semesters of the previous year at the departmental/national level and by type of property.

Yearly data

Descending order
Year
Houses
house
transactions
Houses
house
Price per m²
Apartments
apt.
transactions
Apartments
apt.
Price per m²
2025
7
1 000 
0
--- 
2024
12
648 
0
--- 
2023
13
1 306 
0
--- 
2022
12
954 
0
--- 
2021
11
1 285 
0
--- 
2020
22
1 042 
0
--- 
2019
13
1 131 
0
--- 
2018
9
880 
0
--- 
2017
10
1 232 
0
--- 
2016
5
995 
0
--- 
2015
12
966 
0
--- 
2014
10
912 
0
--- 

Analysis

Structure of prices per m²

Values of price percentiles per m² over the periods used for the estimated price of each type of property.

Structure of transaction amounts

Values of transaction amounts percentiles over the periods used for the estimated price of each type of property.

Transaction amounts and prices per m² by percentile

Ascending order
Percentile
Houses
house
Price per m²
Houses
house
Transaction amount
Apartments
apt.
Price per m²
Apartments
apt.
Transaction amount
10th percentile
365 
29 000 
--- 
--- 
20th percentile
446 
42 000 
--- 
--- 
30th percentile
604 
59 467 
--- 
--- 
40th percentile
825 
80 800 
--- 
--- 
50th percentile
943 
90 000 
--- 
--- 
60th percentile
1 130 
119 K
--- 
--- 
70th percentile
1 313 
130 K
--- 
--- 
80th percentile
1 513 
181 K
--- 
--- 
90th percentile
1 851 
203 K
--- 
--- 

National and departmental comparison

Evolution of the median price per m² of houses

Evolution of the median price per m² of apartments

Quarterly evolution

Evolution of the median price per m²

Evolution of the number of transactions

Quarterly data

Descending order
Quarter
Houses
house
transactions
Houses
house
Price per m²
Apartments
apt.
transactions
Apartments
apt.
Price per m²
2025 Q2
1
2 204 
0
--- 
2025 Q1
6
972 
0
--- 
2024 Q4
1
313 
0
--- 
2024 Q3
4
724 
0
--- 
2024 Q2
3
500 
0
--- 
2024 Q1
4
944 
0
--- 
2023 Q4
7
1 306 
0
--- 
2023 Q3
1
616 
0
--- 
2023 Q2
2
1 204 
0
--- 
2023 Q1
3
1 988 
0
--- 
2022 Q4
3
800 
0
--- 
2022 Q3
3
920 
0
--- 
2022 Q2
5
1 288 
0
--- 
2022 Q1
1
1 875 
0
--- 
2021 Q4
1
890 
0
--- 
2021 Q3
6
1 142 
0
--- 
2021 Q2
2
1 448 
0
--- 
2021 Q1
2
1 131 
0
--- 
2020 Q4
6
975 
0
--- 
2020 Q3
7
1 113 
0
--- 
2020 Q2
5
1 186 
0
--- 
2020 Q1
4
884 
0
--- 
2019 Q4
6
1 371 
0
--- 
2019 Q3
3
1 096 
0
--- 
2019 Q2
2
936 
0
--- 
2019 Q1
2
1 152 
0
--- 
2018 Q4
1
1 395 
0
--- 
2018 Q3
1
710 
0
--- 
2018 Q2
4
964 
0
--- 
2018 Q1
3
880 
0
--- 
2017 Q4
4
1 076 
0
--- 
2017 Q3
3
1 308 
0
--- 
2017 Q2
2
1 280 
0
--- 
2017 Q1
1
820 
0
--- 
2016 Q4
1
1 410 
0
--- 
2016 Q3
2
984 
0
--- 
2016 Q2
2
878 
0
--- 
2015 Q4
5
1 500 
0
--- 
2015 Q3
2
534 
0
--- 
2015 Q2
3
1 094 
0
--- 
2015 Q1
2
961 
0
--- 
2014 Q4
3
946 
0
--- 
2014 Q3
3
726 
0
--- 
2014 Q2
2
792 
0
--- 
2014 Q1
2
1 474 
0
--- 

Overview of the latest real estate transactions

The following list is an anonymized overview of the latest transactions. For more details and to find all transactions, please use the map to view transactions by plot or the transaction search page for a search by criteria.

2025-05-28
205 000 
2 204  /m²(93 m²)
Sale
Houses
House
4 rooms
93 m2
1 outbuilding
Land
778 m2
-Sols
2025-03-27
85 000 
1 104  /m²(77 m²)
Sale
Houses
House
4 rooms
77 m2
1 outbuilding
Land
525 m2
-Sols
2025-03-11
150 000 
1 339  /m²(112 m²)
Sale
Houses
House
5 rooms
112 m2
2 outbuildings
Land
922 m2
-Sols
2025-02-07
3 800 
Sale
Land
4380 m2
-Pâtures
Land
2791 m2
-Peupleraies
2025-02-07
1 000 
Sale
Land
740 m2
-Taillis sous futaie
Land
587 m2
-Taillis sous futaie
2025-01-31
1 500 
Sale
Land
694 m2
-Landes
2025-01-29
60 000 
1 000  /m²(60 m²)
Sale
Houses
House
3 rooms
60 m2
2 outbuildings
Land
246 m2
-Sols
Land
661 m2
-Jardins
2025-01-28
26 000 
433  /m²(60 m²)
Sale
Houses
House
3 rooms
60 m2
Land
423 m2
-Sols
2025-01-22
7 000 
Sale
Land
4147 m2
-Peupleraies
Land
4867 m2
-Peupleraies
2025-01-17
112 000 
862  /m²(130 m²)
Sale
Houses
House
4 rooms
130 m2
Land
274 m2
-Sols
2025-01-11
82 000 
943  /m²(87 m²)
Sale
Houses
House
5 rooms
87 m2
2 outbuildings
Land
341 m2
-Sols
2024-12-26
50 000 
27  /m²(1855 m²)
Sale
Commercial property
1855 m2
Land
4172 m2
-Sols
2024-12-26
700 
Sale
Land
954 m2
-Terres
2024-12-04
25 000 
313  /m²(80 m²)
Sale
Houses
House
5 rooms
80 m2
1 outbuilding
Land
367 m2
-Sols
2024-09-27
90 000 
891  /m²(101 m²)
Sale
Houses
House
6 rooms
101 m2
1 outbuilding
Land
701 m2
-Sols
2024-09-18
48 300 
878  /m²(55 m²)
Auction
Houses
House
2 rooms
55 m2
Land
1754 m2
-Jardins
Land
453 m2
-Sols
2024-08-23
31 000 
330  /m²(94 m²)
Sale
Houses
House
4 rooms
94 m2
1 outbuilding
Land
394 m2
-Sols
2024-08-07
50 000 
556  /m²(90 m²)
Sale
Houses
House
5 rooms
90 m2
1 outbuilding
Land
648 m2
-Sols
2024-07-02
140 000 
1 647  /m²(85 m²)
Sale
Houses
House
4 rooms
85 m2
1 outbuilding
Land
667 m2
-Sols
2024-06-18
80 000 
500  /m²(160 m²)
Sale
Houses
House
6 rooms
160 m2
1 outbuilding
Land
501 m2
-Sols
Land
893 m2
-Jardins

Aisne (02)

Most expensive cities

City
name
Descending orderHouses
house
Price per m²
2 396 
2 332 
2 318 
2 278 
2 213 
2 190 
2 136 
2 134 
City
name
Descending orderApartments
apt.
Price per m²
4 598 
1 786 
1 635 
1 602 
1 559 
1 558 
1 525 

Least expensive cities

City
name
Ascending orderHouses
house
Price per m²
222 
396 
429 
452 
464 
City
name
Ascending orderApartments
apt.
Price per m²
171 
210 
220 
233 
243