emooki
HomePrice mapTransactions
🇬🇧 English🇫🇷 Français🇩🇪 Deutsch🇪🇸 Español🇮🇹 Italiano

Real estate price map


Real estate price map in the municipality of Montigny-sur-Crécy.

Aisne (02)
Montigny-sur-Crécy

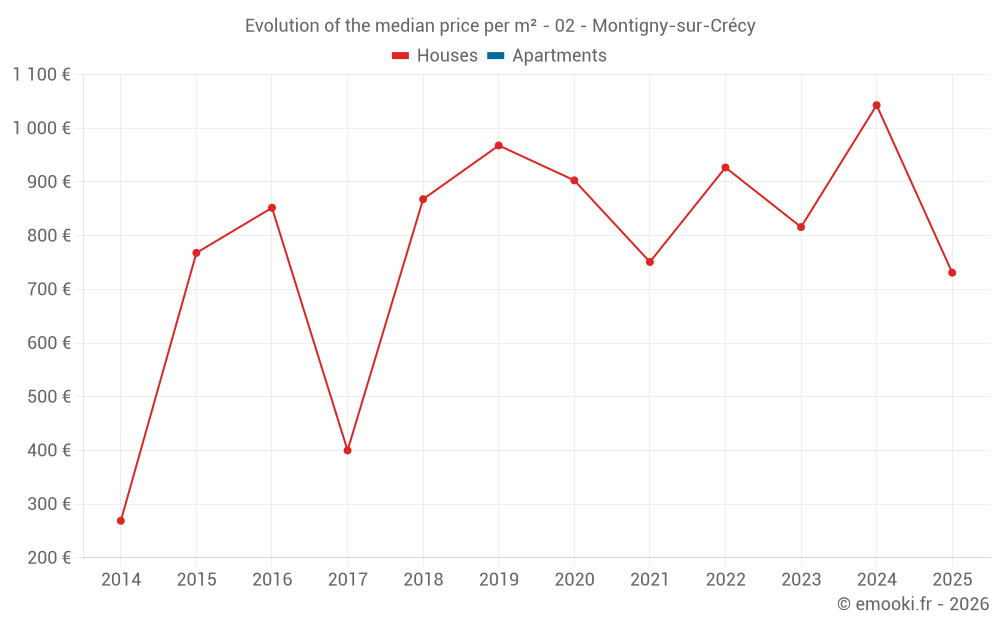
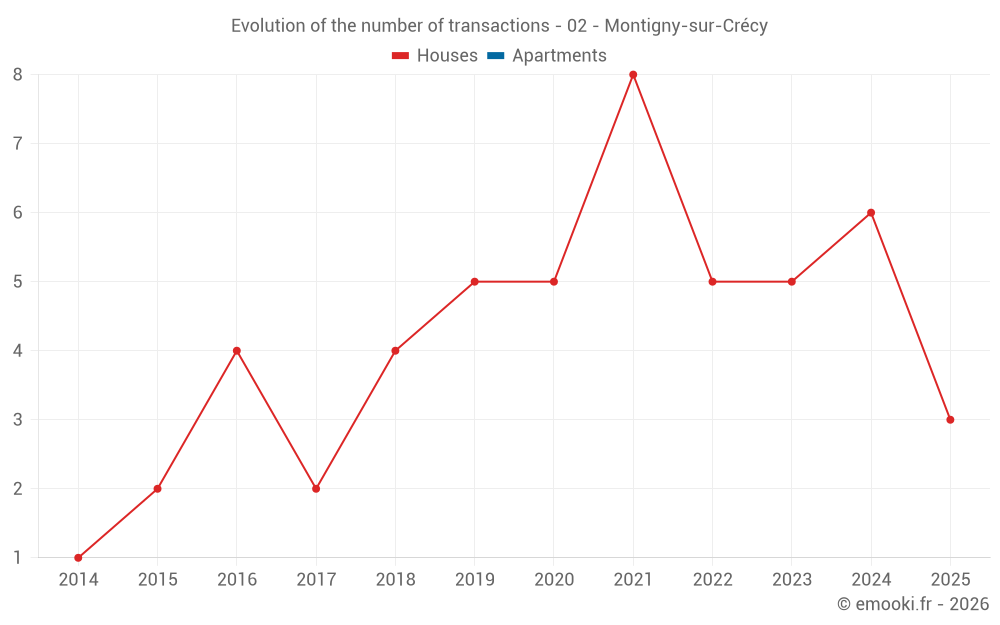
Median price of real estate
in the municipality of Montigny-sur-Crécy

HousesHouses
912  /m²
1-23-45-67-89-10
Reliability 6/10
Median price on the 18 transactions of the last 36 months.
from 508 to
1 329  /m²
60% of transactions from the 2nd to the 8th deciles.
HousesEvolution of the price per m² of houses since...
1 year
--
2 years
--
3 years
--
4 years
--
5 years
--
6 years
--
7 years
--
8 years
--
9 years
--
10 years
--
11 years
--
ApartmentsEvolution of the price per m² of apartments since...
1 year
--
2 years
--
3 years
--
4 years
--
5 years
--
6 years
--
7 years
--
8 years
--
9 years
--
10 years
--
11 years
--

Yearly evolution

Evolution of the median price per m²

Evolution of the number of transactions

Warning, last year incomplete. Projections made based on the proportions between semesters of the previous year at the departmental/national level and by type of property.

Yearly data

Descending order
Year
Houses
house
transactions
Houses
house
Price per m²
Apartments
apt.
transactions
Apartments
apt.
Price per m²
2025
3
731 
0
--- 
2024
6
1 043 
0
--- 
2023
5
816 
0
--- 
2022
5
927 
0
--- 
2021
8
751 
0
--- 
2020
5
903 
0
--- 
2019
5
968 
0
--- 
2018
4
868 
0
--- 
2017
2
400 
0
--- 
2016
4
852 
0
--- 
2015
2
768 
0
--- 
2014
1
269 
0
--- 

Analysis

Structure of prices per m²

Values of price percentiles per m² over the periods used for the estimated price of each type of property.

Structure of transaction amounts

Values of transaction amounts percentiles over the periods used for the estimated price of each type of property.

Transaction amounts and prices per m² by percentile

Ascending order
Percentile
Houses
house
Price per m²
Houses
house
Transaction amount
Apartments
apt.
Price per m²
Apartments
apt.
Transaction amount
10th percentile
384 
32 875 
--- 
--- 
20th percentile
508 
48 950 
--- 
--- 
30th percentile
650 
65 435 
--- 
--- 
40th percentile
739 
85 070 
--- 
--- 
50th percentile
912 
94 025 
--- 
--- 
60th percentile
1 084 
95 900 
--- 
--- 
70th percentile
1 186 
99 860 
--- 
--- 
80th percentile
1 329 
125 K
--- 
--- 
90th percentile
1 484 
141 K
--- 
--- 

National and departmental comparison

Evolution of the median price per m² of houses

Evolution of the median price per m² of apartments

Quarterly evolution

Evolution of the median price per m²

Evolution of the number of transactions

Quarterly data

Descending order
Quarter
Houses
house
transactions
Houses
house
Price per m²
Apartments
apt.
transactions
Apartments
apt.
Price per m²
2025 Q2
1
400 
0
--- 
2025 Q1
2
1 048 
0
--- 
2024 Q4
2
1 447 
0
--- 
2024 Q3
1
1 078 
0
--- 
2024 Q1
3
422 
0
--- 
2023 Q4
2
1 504 
0
--- 
2023 Q3
1
345 
0
--- 
2023 Q2
2
728 
0
--- 
2022 Q4
1
1 427 
0
--- 
2022 Q3
3
741 
0
--- 
2022 Q2
1
927 
0
--- 
2021 Q4
1
283 
0
--- 
2021 Q3
1
1 727 
0
--- 
2021 Q2
4
1 076 
0
--- 
2021 Q1
2
234 
0
--- 
2020 Q3
2
924 
0
--- 
2020 Q2
1
903 
0
--- 
2020 Q1
2
806 
0
--- 
2019 Q4
2
999 
0
--- 
2019 Q3
2
934 
0
--- 
2019 Q2
1
1 218 
0
--- 
2018 Q4
4
868 
0
--- 
2017 Q4
1
351 
0
--- 
2017 Q2
1
449 
0
--- 
2016 Q3
1
824 
0
--- 
2016 Q2
2
772 
0
--- 
2016 Q1
1
1 000 
0
--- 
2015 Q2
1
1 061 
0
--- 
2015 Q1
1
474 
0
--- 
2014 Q2
1
269 
0
--- 

Aisne (02)

Most expensive cities

City
name
Descending orderHouses
house
Price per m²
2 396 
2 332 
2 318 
2 278 
2 213 
2 190 
2 136 
2 134 
City
name
Descending orderApartments
apt.
Price per m²
4 598 
1 786 
1 635 
1 602 
1 559 
1 558 
1 525 

Least expensive cities

City
name
Ascending orderHouses
house
Price per m²
222 
396 
429 
452 
464 
City
name
Ascending orderApartments
apt.
Price per m²
171 
210 
220 
233 
243