emooki
HomePrice mapTransactions
🇬🇧 English🇫🇷 Français🇩🇪 Deutsch🇪🇸 Español🇮🇹 Italiano

Real estate price map


Real estate price map in the municipality of Marizy-Sainte-Geneviève.

Aisne (02)
Marizy-Sainte-Geneviève

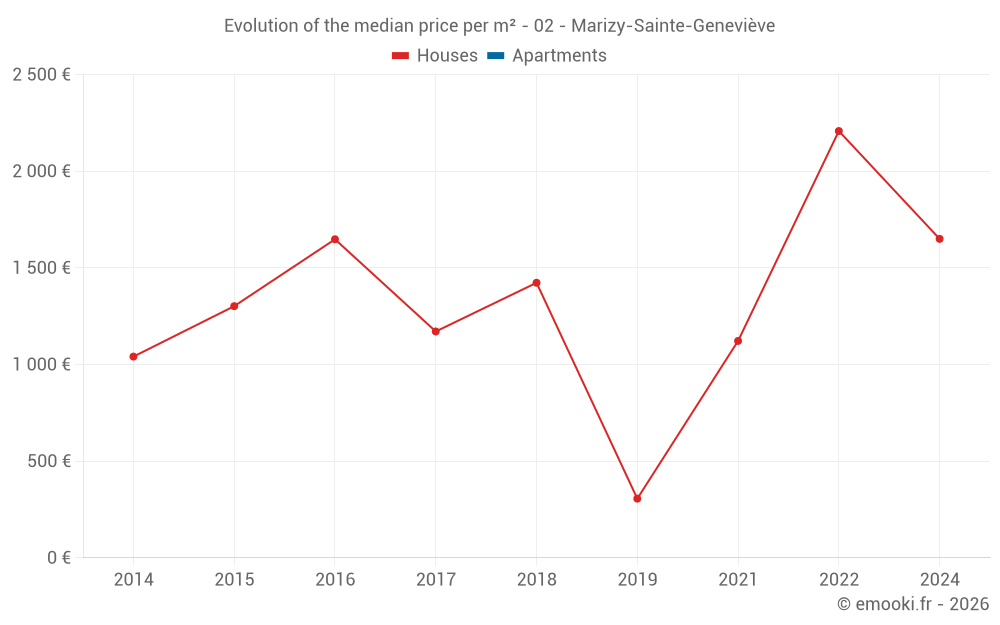
Median price of real estate
in the municipality of Marizy-Sainte-Geneviève

HousesHouses
1 186  /m²
1-23-45-67-89-10
Reliability 2/10
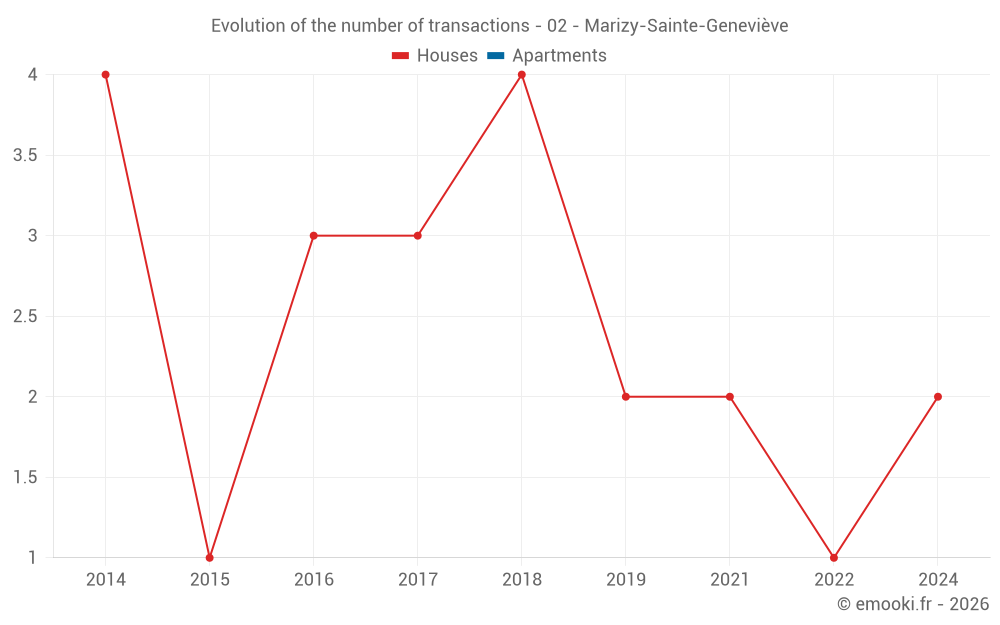
Median price on the 14 transactions of the last 96 months.
from 838 to
1 715  /m²
60% of transactions from the 2nd to the 8th deciles.
HousesEvolution of the price per m² of houses since...
1 year
--
2 years
--
3 years
--
4 years
--
5 years
--
6 years
--
7 years
--
8 years
--
9 years
--
10 years
--
11 years
--
ApartmentsEvolution of the price per m² of apartments since...
1 year
--
2 years
--
3 years
--
4 years
--
5 years
--
6 years
--
7 years
--
8 years
--
9 years
--
10 years
--
11 years
--

Yearly evolution

Evolution of the median price per m²

Evolution of the number of transactions

Warning, last year incomplete.

Yearly data

Descending order
Year
Houses
house
transactions
Houses
house
Price per m²
Apartments
apt.
transactions
Apartments
apt.
Price per m²
2025
0
--- 
0
--- 
2024
2
1 650 
0
--- 
2023
0
--- 
0
--- 
2022
1
2 208 
0
--- 
2021
2
1 122 
0
--- 
2020
0
--- 
0
--- 
2019
2
306 
0
--- 
2018
4
1 423 
0
--- 
2017
3
1 171 
0
--- 
2016
3
1 648 
0
--- 
2015
1
1 302 
0
--- 
2014
4
1 041 
0
--- 

Analysis

Structure of prices per m²

Values of price percentiles per m² over the periods used for the estimated price of each type of property.

Structure of transaction amounts

Values of transaction amounts percentiles over the periods used for the estimated price of each type of property.

Transaction amounts and prices per m² by percentile

Ascending order
Percentile
Houses
house
Price per m²
Houses
house
Transaction amount
Apartments
apt.
Price per m²
Apartments
apt.
Transaction amount
10th percentile
519 
75 750 
--- 
--- 
20th percentile
838 
104 K
--- 
--- 
30th percentile
1 039 
110 K
--- 
--- 
40th percentile
1 168 
124 K
--- 
--- 
50th percentile
1 186 
132 K
--- 
--- 
60th percentile
1 328 
140 K
--- 
--- 
70th percentile
1 486 
145 K
--- 
--- 
80th percentile
1 715 
155 K
--- 
--- 
90th percentile
2 112 
170 K
--- 
--- 

National and departmental comparison

Evolution of the median price per m² of houses

Evolution of the median price per m² of apartments

Quarterly evolution

Evolution of the median price per m²

Evolution of the number of transactions

Quarterly data

Descending order
Quarter
Houses
house
transactions
Houses
house
Price per m²
Apartments
apt.
transactions
Apartments
apt.
Price per m²
2024 Q3
1
2 134 
0
--- 
2024 Q1
1
1 167 
0
--- 
2022 Q4
1
2 208 
0
--- 
2021 Q2
1
1 044 
0
--- 
2021 Q1
1
1 200 
0
--- 
2019 Q1
2
306 
0
--- 
2018 Q3
1
1 360 
0
--- 
2018 Q2
2
1 240 
0
--- 
2018 Q1
1
2 059 
0
--- 
2017 Q4
1
1 171 
0
--- 
2017 Q3
2
984 
0
--- 
2016 Q4
2
2 137 
0
--- 
2016 Q3
1
1 648 
0
--- 
2015 Q4
1
1 302 
0
--- 
2014 Q4
1
1 053 
0
--- 
2014 Q3
1
950 
0
--- 
2014 Q1
2
1 356 
0
--- 

Aisne (02)

Most expensive cities

City
name
Descending orderHouses
house
Price per m²
2 396 
2 332 
2 318 
2 278 
2 213 
2 190 
2 136 
2 134 
City
name
Descending orderApartments
apt.
Price per m²
4 598 
1 786 
1 635 
1 602 
1 559 
1 558 
1 525 

Least expensive cities

City
name
Ascending orderHouses
house
Price per m²
222 
396 
429 
452 
464 
City
name
Ascending orderApartments
apt.
Price per m²
171 
210 
220 
233 
243