Real estate price map
Real estate price map in the municipality of Guise, choose a section to see transactions by parcel.
Aisne (02)
Price per m² in Guise
Median price of real estate
in the municipality of Guise
Houses
660 € /m²
Reliability 9/10
Median price on the 27 transactions of the last 6 months.
from 374 to
1 227 € /m²
1 227 € /m²
60% of transactions from the 2nd to the 8th deciles.
Apartments
538 € /m²
Reliability 6/10
Median price on the 21 transactions of the last 36 months.
from 262 to
746 € /m²
746 € /m²
60% of transactions from the 2nd to the 8th deciles.
Dwellings
660 € /m²
Reliability 9/10
Median price on the 29 transactions of the last 6 months.
from 379 to
1 168 € /m²
1 168 € /m²
60% of transactions from the 2nd to the 8th deciles.
Evolution of the price per m² of houses since...
1 year
+22%
2 years
+0.4%
3 years
-4.8%
4 years
+7.3%
5 years
+20%
6 years
+4.4%
7 years
+16%
8 years
+67%
9 years
+29%
10 years
+29%
11 years
-2.4%
The price per m² of houses has decreased by 4.8% since 3 years, but it has increased by 67% in 8 years.
Evolution of the price per m² of apartments since...
1 year
-42%
2 years
-6.7%
3 years
-23%
4 years
-3.3%
5 years
+28%
6 years
+30%
7 years
--
8 years
-4%
9 years
+4.1%
10 years
-25%
11 years
--
The price per m² of apartments has decreased by 42% since 1 year, but it has increased by 30% in 6 years.
829 transactions listed in the municipality
Yearly data
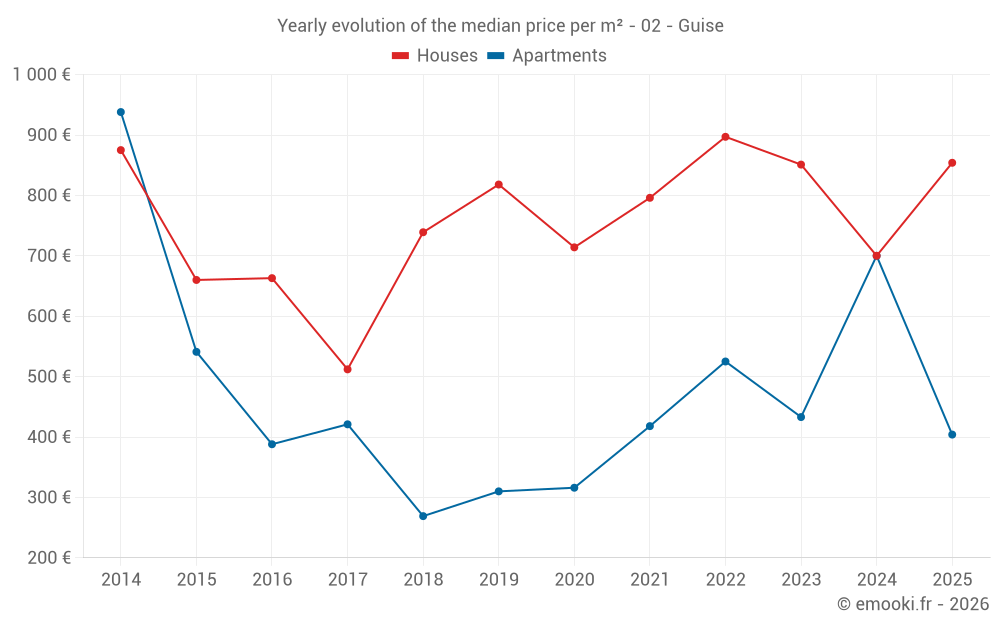
Yearly evolution of the median price per m²
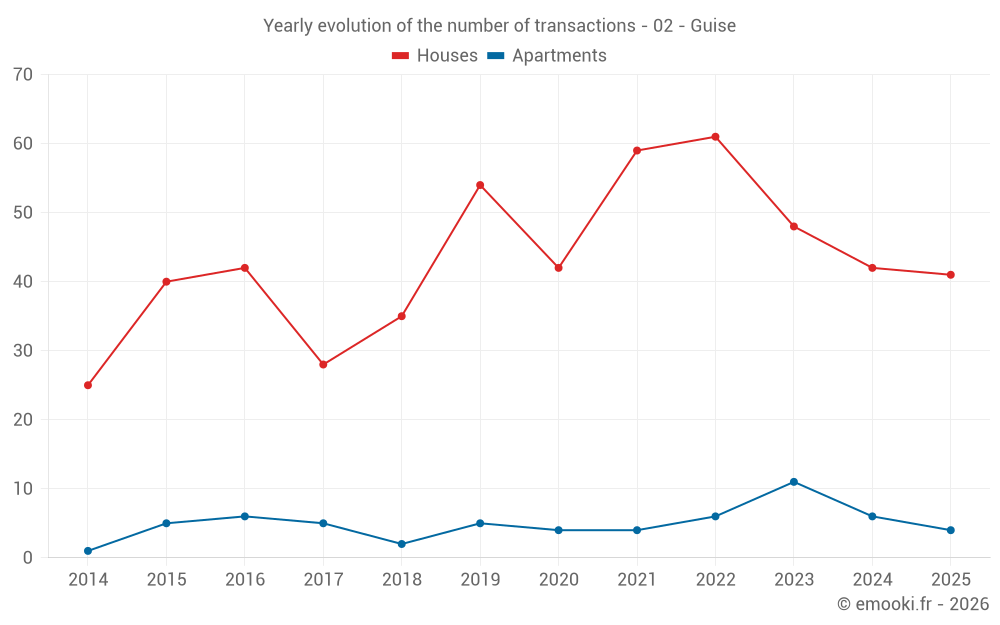
Yearly evolution of the number of transactions
Yearly table
Year
house
transactions
transactions
house
Price per m²
Price per m²
apt.
transactions
transactions
apt.
Price per m²
Price per m²
2025
41
854 €
4
404 €
2024
42
700 €
6
700 €
2023
48
851 €
11
433 €
2022
61
897 €
6
525 €
2021
59
796 €
4
418 €
2020
42
714 €
4
316 €
2019
54
818 €
5
310 €
2018
35
739 €
2
269 €
2017
28
512 €
5
421 €
2016
42
663 €
6
388 €
2015
40
660 €
5
541 €
2014
25
875 €
1
938 €
Analysis
Structure of prices per m²
Values of price percentiles per m² over the periods used for the estimated price of each type of property.
Structure of transaction amounts
Values of transaction amounts percentiles over the periods used for the estimated price of each type of property.
Transaction amounts and prices per m² by percentile
Percentile
house
Price per m²
Price per m²
house
Transaction amount
Transaction amount
apt.
Price per m²
Price per m²
apt.
Transaction amount
Transaction amount
10th percentile
361 €
32 200 €
185 €
30 000 €
20th percentile
374 €
37 200 €
262 €
42 000 €
30th percentile
437 €
44 800 €
288 €
45 000 €
40th percentile
591 €
52 000 €
433 €
55 000 €
50th percentile
660 €
65 000 €
538 €
65 500 €
60th percentile
876 €
76 000 €
549 €
82 000 €
70th percentile
995 €
91 000 €
617 €
86 300 €
80th percentile
1 227 €
111 K€
746 €
120 K€
90th percentile
1 435 €
137 K€
791 €
162 K€
National and departmental comparison
Evolution of the median price per m² of houses
Evolution of the median price per m² of apartments
Quarterly data
Quarterly evolution of the median price per m²
Quarterly evolution of the number of transactions
Quarterly table
Quarter
house
transactions
transactions
house
Price per m²
Price per m²
apt.
transactions
transactions
apt.
Price per m²
Price per m²
2025 Q4
17
854 €
0
--- €
2025 Q3
10
592 €
2
664 €
2025 Q2
7
1 005 €
1
238 €
2025 Q1
7
1 139 €
1
270 €
2024 Q4
16
746 €
3
762 €
2024 Q3
9
630 €
1
746 €
2024 Q2
11
878 €
0
--- €
2024 Q1
6
658 €
2
420 €
2023 Q4
16
1 014 €
5
433 €
2023 Q3
13
765 €
0
--- €
2023 Q2
10
795 €
4
578 €
2023 Q1
9
719 €
2
275 €
2022 Q4
12
772 €
2
525 €
2022 Q3
21
999 €
2
575 €
2022 Q2
18
788 €
1
1 396 €
2022 Q1
10
966 €
1
518 €
2021 Q4
12
774 €
2
328 €
2021 Q3
16
829 €
1
398 €
2021 Q2
15
779 €
1
504 €
2021 Q1
16
592 €
0
--- €
2020 Q4
16
623 €
3
294 €
2020 Q3
10
875 €
0
--- €
2020 Q2
6
749 €
1
339 €
2020 Q1
10
660 €
0
--- €
2019 Q4
15
761 €
1
133 €
2019 Q3
18
928 €
0
--- €
2019 Q2
11
794 €
3
310 €
2019 Q1
10
817 €
1
398 €
2018 Q4
14
712 €
2
269 €
2018 Q3
7
694 €
0
--- €
2018 Q2
10
867 €
0
--- €
2018 Q1
4
898 €
0
--- €
2017 Q4
5
600 €
3
437 €
2017 Q3
7
494 €
2
364 €
2017 Q2
10
431 €
0
--- €
2017 Q1
6
512 €
0
--- €
2016 Q4
4
684 €
3
380 €
2016 Q3
12
762 €
2
364 €
2016 Q2
18
745 €
0
--- €
2016 Q1
8
529 €
1
395 €
2015 Q4
6
635 €
0
--- €
2015 Q3
13
684 €
1
614 €
2015 Q2
13
617 €
3
482 €
2015 Q1
8
752 €
1
784 €
2014 Q4
5
1 145 €
0
--- €
2014 Q3
7
720 €
1
938 €
2014 Q2
7
753 €
0
--- €
2014 Q1
6
990 €
0
--- €
Key takeaways
What is the price per m2 of houses in Guise?
The median price on the 27 house transactions of the last 6 months in the municipality of Guise was 660 € per square meter for a median property value of 65 000 €. Over this period, 60% of transactions were between 374 and 1 227 € per square meter (from the 2nd to the 8th deciles).
Compare with neighboring municipalities
City
name
name
house
Price per m²
Price per m²
apt.
Price per m²
Price per m²
City information
Zip code
- 02120 GUISE