emooki
HomePrice mapTransactions
🇬🇧 English🇫🇷 Français🇩🇪 Deutsch🇪🇸 Español🇮🇹 Italiano

Real estate price map


Real estate price map in the municipality of La Fère.

Aisne (02)
La Fère

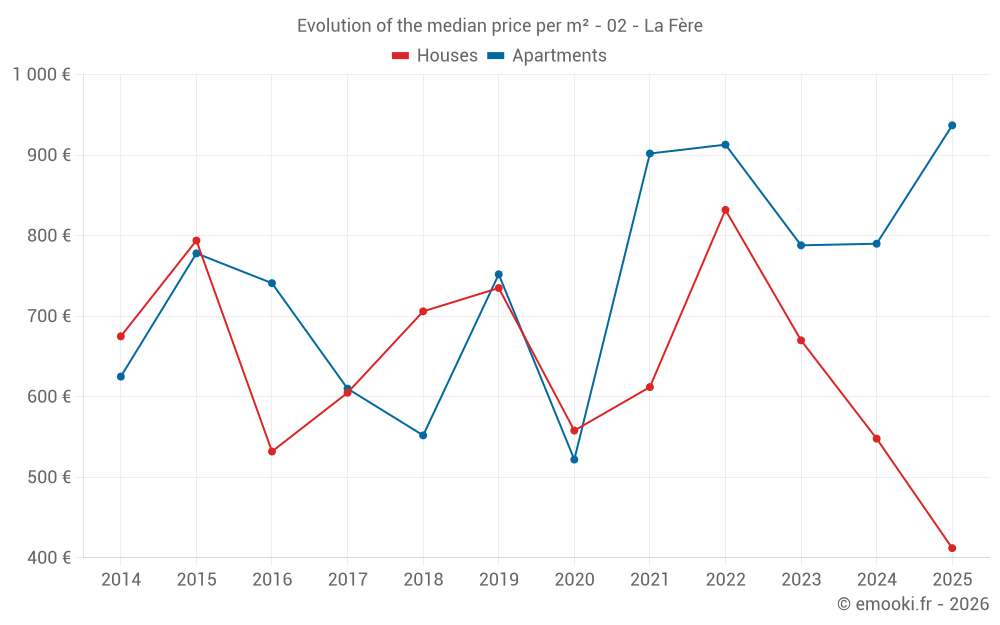
Median price of real estate
in the municipality of La Fère

HousesHouses
475  /m²
1-23-45-67-89-10
Reliability 8/10
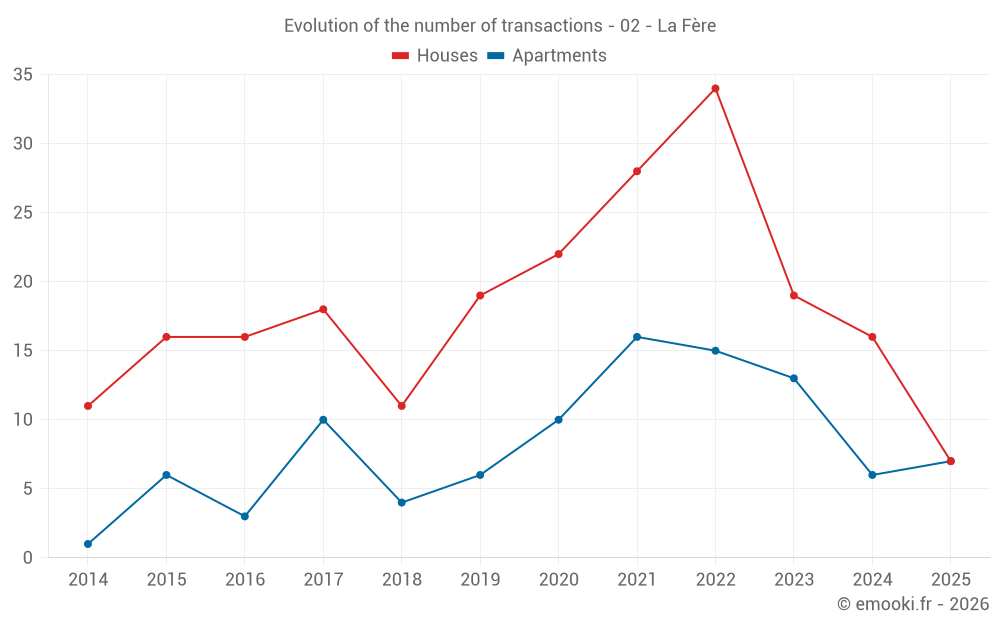
Median price on the 16 transactions of the last 12 months.
from 368 to
1 268  /m²
60% of transactions from the 2nd to the 8th deciles.
ApartmentsApartments
904  /m²
1-23-45-67-89-10
Reliability 7/10
Median price on the 17 transactions of the last 24 months.
from 736 to
1 294  /m²
60% of transactions from the 2nd to the 8th deciles.
DwellingsDwellings
736  /m²
1-23-45-67-89-10
Reliability 8/10
Median price on the 26 transactions of the last 12 months.
from 412 to
1 286  /m²
60% of transactions from the 2nd to the 8th deciles.
HousesEvolution of the price per m² of houses since...
1 year
-25%
2 years
-39%
3 years
-50%
4 years
-33%
5 years
-26%
6 years
-44%
7 years
-42%
8 years
-32%
9 years
-23%
10 years
-48%
11 years
-39%
ApartmentsEvolution of the price per m² of apartments since...
1 year
+19%
2 years
+19%
3 years
+2.6%
4 years
+3.9%
5 years
+80%
6 years
+25%
7 years
--
8 years
+54%
9 years
--
10 years
+20%
11 years
--

Yearly evolution

Evolution of the median price per m²

Evolution of the number of transactions

Warning, last year incomplete. Projections made based on the proportions between semesters of the previous year at the departmental/national level and by type of property.

Yearly data

Descending order
Year
Houses
house
transactions
Houses
house
Price per m²
Apartments
apt.
transactions
Apartments
apt.
Price per m²
2025
7
412 
7
937 
2024
16
548 
6
790 
2023
19
670 
13
788 
2022
34
832 
15
913 
2021
28
612 
16
902 
2020
22
558 
10
522 
2019
19
735 
6
752 
2018
11
706 
4
552 
2017
18
605 
10
610 
2016
16
532 
3
741 
2015
16
794 
6
778 
2014
11
675 
1
625 

Analysis

Structure of prices per m²

Values of price percentiles per m² over the periods used for the estimated price of each type of property.

Structure of transaction amounts

Values of transaction amounts percentiles over the periods used for the estimated price of each type of property.

Transaction amounts and prices per m² by percentile

Ascending order
Percentile
Houses
house
Price per m²
Houses
house
Transaction amount
Apartments
apt.
Price per m²
Apartments
apt.
Transaction amount
10th percentile
312 
30 450 
616 
53 000 
20th percentile
368 
30 900 
736 
66 000 
30th percentile
400 
52 250 
747 
74 720 
40th percentile
427 
70 000 
850 
79 900 
50th percentile
475 
79 200 
904 
88 500 
60th percentile
686 
87 500 
1 025 
90 000 
70th percentile
982 
109 K
1 286 
97 180 
80th percentile
1 268 
155 K
1 294 
99 580 
90th percentile
1 728 
194 K
1 403 
151 K

National and departmental comparison

Evolution of the median price per m² of houses

Evolution of the median price per m² of apartments

Quarterly evolution

Evolution of the median price per m²

Evolution of the number of transactions

Quarterly data

Descending order
Quarter
Houses
house
transactions
Houses
house
Price per m²
Apartments
apt.
transactions
Apartments
apt.
Price per m²
2025 Q2
3
333 
5
937 
2025 Q1
4
1 144 
2
1 016 
2024 Q4
4
641 
2
628 
2024 Q3
5
686 
1
830 
2024 Q2
4
495 
2
1 090 
2024 Q1
3
549 
1
1 286 
2023 Q4
5
649 
1
1 083 
2023 Q3
2
786 
3
879 
2023 Q2
8
702 
2
800 
2023 Q1
4
724 
7
584 
2022 Q4
6
701 
4
889 
2022 Q3
9
943 
3
1 176 
2022 Q2
10
1 064 
3
913 
2022 Q1
9
422 
5
630 
2021 Q4
7
461 
3
879 
2021 Q3
7
1 271 
7
907 
2021 Q2
6
597 
4
820 
2021 Q1
8
622 
2
1 148 
2020 Q4
6
706 
1
740 
2020 Q3
10
502 
2
518 
2020 Q2
2
562 
2
817 
2020 Q1
4
618 
5
373 
2019 Q4
7
1 000 
2
728 
2019 Q3
4
574 
0
--- 
2019 Q2
5
679 
2
952 
2019 Q1
3
800 
2
491 
2018 Q4
5
771 
2
348 
2018 Q3
1
346 
0
--- 
2018 Q2
3
779 
0
--- 
2018 Q1
2
406 
2
675 
2017 Q4
2
559 
1
290 
2017 Q3
5
485 
4
636 
2017 Q2
7
584 
3
476 
2017 Q1
4
702 
2
592 
2016 Q4
4
786 
1
288 
2016 Q3
3
1 017 
0
--- 
2016 Q2
4
532 
2
913 
2016 Q1
5
313 
0
--- 
2015 Q4
3
846 
2
877 
2015 Q3
6
913 
0
--- 
2015 Q2
5
781 
2
860 
2015 Q1
2
544 
2
704 
2014 Q4
5
607 
1
625 
2014 Q3
4
693 
0
--- 
2014 Q1
2
976 
0
--- 

Aisne (02)

Most expensive cities

City
name
Descending orderHouses
house
Price per m²
2 396 
2 332 
2 318 
2 278 
2 213 
2 190 
2 136 
2 134 
City
name
Descending orderApartments
apt.
Price per m²
4 598 
1 786 
1 635 
1 602 
1 559 
1 558 
1 525 

Least expensive cities

City
name
Ascending orderHouses
house
Price per m²
222 
396 
429 
452 
464 
City
name
Ascending orderApartments
apt.
Price per m²
171 
210 
220 
233 
243