emooki
HomePrice mapTransactions
🇬🇧 English🇫🇷 Français🇩🇪 Deutsch🇪🇸 Español🇮🇹 Italiano

Real estate price map


Real estate price map in the municipality of La Capelle, choose a section to see transactions by parcel.

Aisne (02)

La Capelle - Real estate price m²

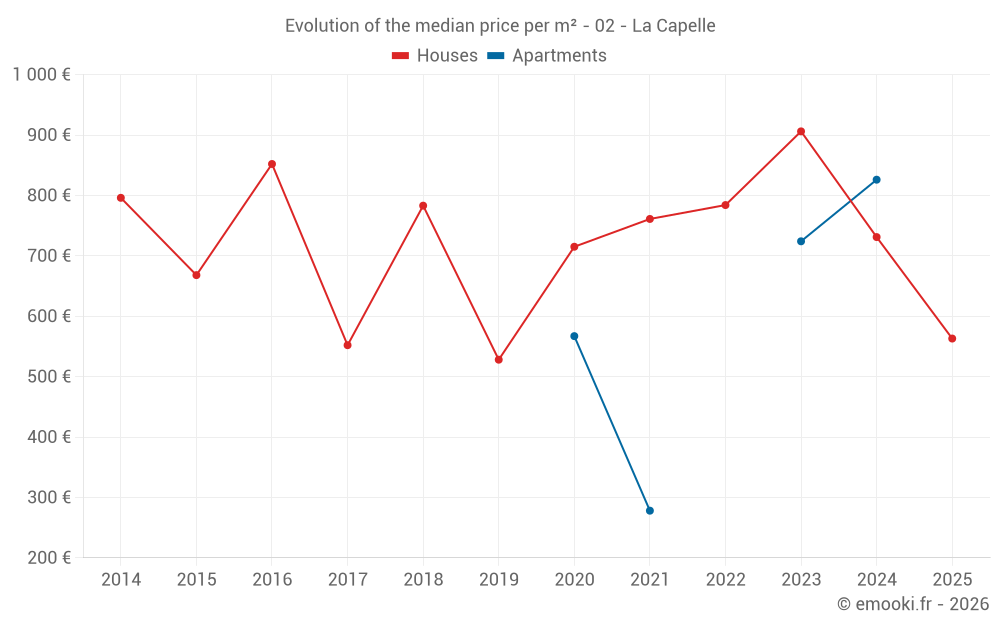
Median price of real estate
in the municipality of La Capelle

HousesHouses
731  /m²
1-23-45-67-89-10
Reliability 7/10
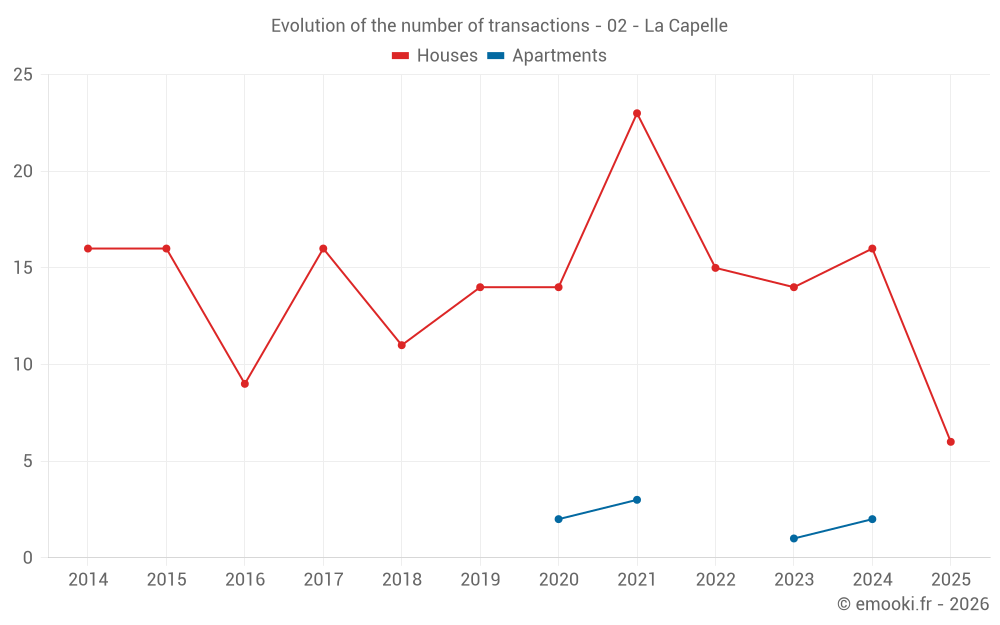
Median price on the 32 transactions of the last 24 months.
from 451 to
1 093  /m²
60% of transactions from the 2nd to the 8th deciles.
ApartmentsApartments
599  /m²
1-23-45-67-89-10
Reliability 3/10
Median price on the 8 transactions of the last 72 months.
DwellingsDwellings
624  /m²
1-23-45-67-89-10
Reliability 8/10
Median price on the 16 transactions of the last 12 months.
from 348 to
1 148  /m²
60% of transactions from the 2nd to the 8th deciles.
HousesEvolution of the price per m² of houses since...
1 year
-23%
2 years
-38%
3 years
-28%
4 years
-26%
5 years
-21%
6 years
+6.6%
7 years
-28%
8 years
+2%
9 years
-34%
10 years
-16%
11 years
-29%
The price per m² of houses has decreased by 38% since 2 years, but it has increased by 6.6% in 6 years.

Yearly evolution

Evolution of the median price per m²

Evolution of the median price per m² - 02 - La Capelle

Evolution of the number of transactions

Warning, last year incomplete. Projections made based on the proportions between semesters of the previous year at the departmental/national level and by type of property.

Evolution of the number of transactions - 02 - La Capelle

Yearly data

Descending order
Year
Houses
house
transactions
Houses
house
Price per m²
Apartments
apt.
transactions
Apartments
apt.
Price per m²
2025
6
563 
0
--- 
2024
16
731 
2
826 
2023
14
906 
1
724 
2022
15
784 
0
--- 
2021
23
761 
3
278 
2020
14
715 
2
567 
2019
14
528 
0
--- 
2018
11
783 
0
--- 
2017
16
552 
0
--- 
2016
9
852 
0
--- 
2015
16
668 
0
--- 
2014
16
796 
0
--- 

Analysis

Structure of prices per m²

Values of price percentiles per m² over the periods used for the estimated price of each type of property.

Structure of transaction amounts

Values of transaction amounts percentiles over the periods used for the estimated price of each type of property.

Transaction amounts and prices per m² by percentile

Ascending order
Percentile
Houses
house
Price per m²
Houses
house
Transaction amount
Apartments
apt.
Price per m²
Apartments
apt.
Transaction amount
10th percentile
349 
27 750 
186 
32 800 
20th percentile
451 
35 300 
227 
42 000 
30th percentile
534 
42 900 
301 
54 800 
40th percentile
617 
58 800 
459 
60 400 
50th percentile
731 
62 500 
599 
71 000 
60th percentile
914 
71 800 
700 
81 200 
70th percentile
977 
82 000 
721 
85 400 
80th percentile
1 093 
107 K
868 
97 400 
90th percentile
1 360 
120 K
1 019 
113 K

National and departmental comparison

Evolution of the median price per m² of houses

Evolution of the median price per m² of apartments

Quarterly evolution

Evolution of the median price per m²

Evolution of the number of transactions

Quarterly data

Descending order
Quarter
Houses
house
transactions
Houses
house
Price per m²
Apartments
apt.
transactions
Apartments
apt.
Price per m²
2025 Q2
3
938 
0
--- 
2025 Q1
3
545 
0
--- 
2024 Q4
5
667 
1
1 148 
2024 Q3
4
742 
0
--- 
2024 Q2
2
836 
0
--- 
2024 Q1
5
878 
1
504 
2023 Q4
6
1 070 
0
--- 
2023 Q3
4
636 
0
--- 
2023 Q2
1
1 542 
1
724 
2023 Q1
3
686 
0
--- 
2022 Q4
5
955 
0
--- 
2022 Q3
4
749 
0
--- 
2022 Q2
2
1 076 
0
--- 
2022 Q1
4
810 
0
--- 
2021 Q4
7
1 233 
2
486 
2021 Q3
6
825 
0
--- 
2021 Q2
6
608 
0
--- 
2021 Q1
4
612 
1
193 
2020 Q4
5
885 
1
964 
2020 Q3
3
605 
0
--- 
2020 Q2
2
818 
0
--- 
2020 Q1
4
624 
1
170 
2019 Q4
6
447 
0
--- 
2019 Q3
1
305 
0
--- 
2019 Q2
4
720 
0
--- 
2019 Q1
3
913 
0
--- 
2018 Q4
6
1 044 
0
--- 
2018 Q3
2
1 010 
0
--- 
2018 Q2
3
299 
0
--- 
2017 Q4
4
464 
0
--- 
2017 Q3
6
521 
0
--- 
2017 Q2
5
805 
0
--- 
2017 Q1
1
796 
0
--- 
2016 Q4
5
650 
0
--- 
2016 Q3
2
702 
0
--- 
2016 Q2
1
978 
0
--- 
2016 Q1
1
1 293 
0
--- 
2015 Q4
2
588 
0
--- 
2015 Q3
4
442 
0
--- 
2015 Q2
8
825 
0
--- 
2015 Q1
2
894 
0
--- 
2014 Q4
2
1 060 
0
--- 
2014 Q3
8
660 
0
--- 
2014 Q2
4
796 
0
--- 
2014 Q1
2
1 660 
0
--- 

Overview of the latest real estate transactions

The following list is an anonymized overview of the latest transactions. For more details and to find all transactions, please use the map to view transactions by plot or the transaction search page for a search by criteria.

2025-04-29
60 000 
938  /m²(64 m²)
Sale
Houses
House
4 rooms
64 m2
1 outbuilding
Land
413 m2
-Sols
2025-04-25
135 700 
481  /m²(282 m²)
1 762  /m²(77 m²)
Sale
Apartments
Apartment
2 rooms
33 m2
Apartments
Apartment
2 rooms
44 m2
Commercial property
205 m2
1 outbuilding
Land
772 m2
-Sols
2025-04-24
27 500 
248  /m²(111 m²)
Sale
Houses
House
3 rooms
111 m2
1 outbuilding
Land
286 m2
-Sols
Land
729 m2
-Jardins
2025-04-14
190 000 
1 293  /m²(147 m²)
Sale
Houses
House
4 rooms
147 m2
Land
2875 m2
-Jardins
Land
990 m2
-Sols
2025-02-26
66 800 
581  /m²(115 m²)
Sale
Houses
House
1 room
115 m2
4 outbuildings
Land
1694 m2
-Sols
Land
1346 m2
-Pâtures
Land
301 m2
-Jardins
Land
267 m2
-Jardins
2025-01-22
53 814 
Sale
Land
4490 m2
-Pâtures
Land
40 m2
-Pâtures
Land
4590 m2
-Pâtures
Land
2140 m2
-Pâtures
Land
12095 m2
-Pâtures
Land
2 m2
-Pâtures
Land
2455 m2
-Pâtures
Land
1280 m2
-Pâtures
Land
17970 m2
-Pâtures
Land
22205 m2
-Pâtures
2025-01-22
110 000 
348  /m²(316 m²)
Sale
Houses
House
9 rooms
316 m2
1 outbuilding
Land
413 m2
-Sols
Land
29 m2
-Sols
2025-01-22
30 000 
545  /m²(55 m²)
Sale
Houses
House
3 rooms
55 m2
1 outbuilding
Land
326 m2
-Sols
2024-12-30
24 636 
Sale
Land
2053 m2
-Pâtures
2024-12-27
77 500 
760  /m²(102 m²)
Sale
Houses
House
6 rooms
102 m2
1 outbuilding
Land
179 m2
-Sols
2024-12-23
35 000 
354  /m²(99 m²)
Sale
Houses
House
5 rooms
99 m2
Land
208 m2
-Sols
2024-12-20
75 000 
100  /m²(750 m²)
Sale
Commercial property
750 m2
Land
973 m2
-Sols
Land
871 m2
-Sols
2024-11-21
11 500 
240  /m²(48 m²)
Sale
Houses
House
3 rooms
48 m2
Land
78 m2
-Sols
2024-11-20
60 000 
667  /m²(90 m²)
Sale
Houses
House
4 rooms
90 m2
Land
185 m2
-Sols
2024-11-19
120 000 
1 538  /m²(78 m²)
Sale
Houses
House
3 rooms
78 m2
Land
693 m2
-Jardins
Land
611 m2
-Sols
2024-10-21
62 000 
1 148  /m²(54 m²)
Sale
Apartments
Apartment
2 rooms
54 m2
2 outbuildings
2024-09-26
9 000 
114  /m²(79 m²)
Sale
Houses
House
3 rooms
79 m2
Land
158 m2
-Sols
Land
250 m2
-Jardins
2024-08-29
40 000 
506  /m²(79 m²)
Sale
Houses
House
4 rooms
79 m2
2 outbuildings
Land
88 m2
-Sols
Land
60 m2
-Sols
Land
197 m2
-Jardins
Land
75 m2
-Sols
Land
158 m2
-Jardins
Land
42 m2
-Sols
Land
18 m2
-Sols
2024-08-27
4 664 
40  /m²(116 m²)
52  /m²(90 m²)
Sale
Houses
House
5 rooms
90 m2
Commercial property
26 m2
1 outbuilding
Land
568 m2
-Sols
Land
25 m2
-Jardins
2024-08-20
20 265 
transaction.nature.Vente terrain à bâtir
Land
579 m2
-Terrains à bâtir
294 transactions listed in the municipality

Aisne (02)

Most expensive cities

City
name
Descending orderHouses
house
Price per m²
2 396 
2 332 
2 318 
2 278 
2 213 
2 190 
2 136 
2 134 
City
name
Descending orderApartments
apt.
Price per m²
4 598 
1 786 
1 635 
1 602 
1 559 
1 558 
1 525 

Least expensive cities

City
name
Ascending orderHouses
house
Price per m²
222 
396 
429 
452 
464 
City
name
Ascending orderApartments
apt.
Price per m²
171 
210 
220 
233 
243